

Novel method to label solid lipid nanoparticles with 64cu for positron emission tomography imaging
- PMID: 21388194
- PMCID: PMC3086097
- DOI: 10.1021/bc100478k
Novel method to label solid lipid nanoparticles with 64cu for positron emission tomography imaging
Abstract
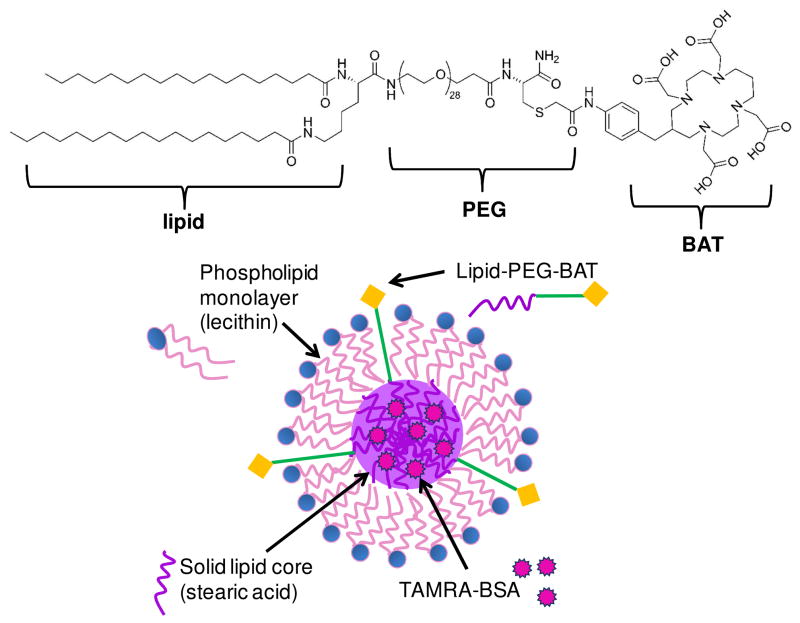
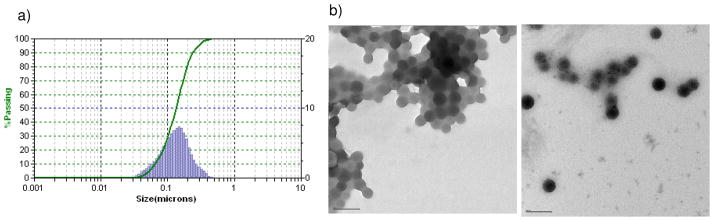
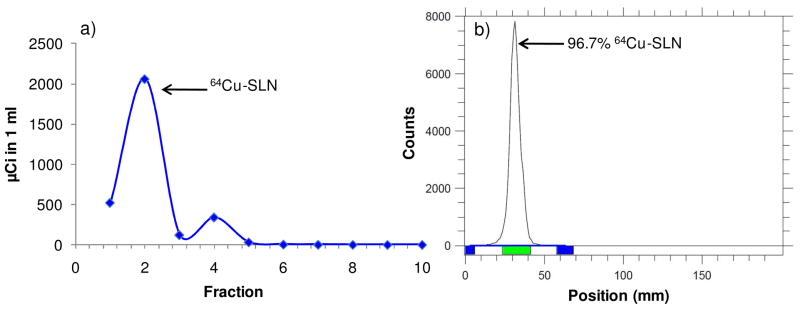
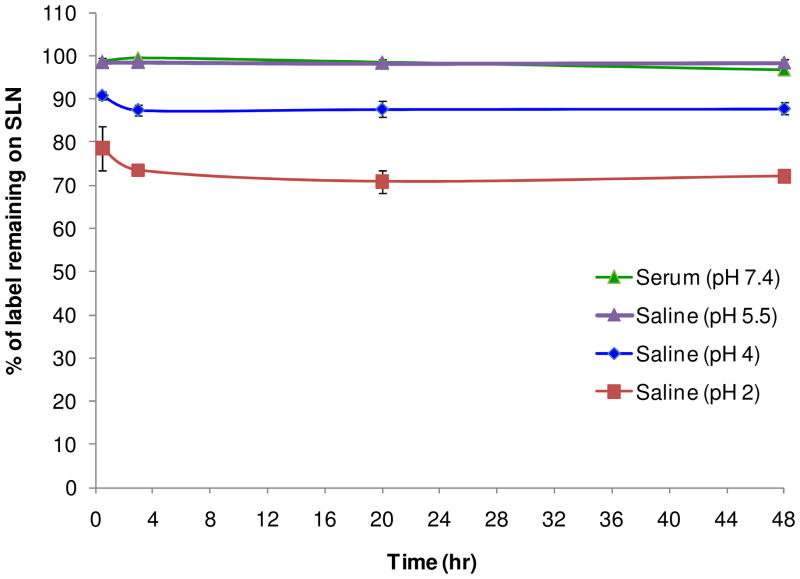
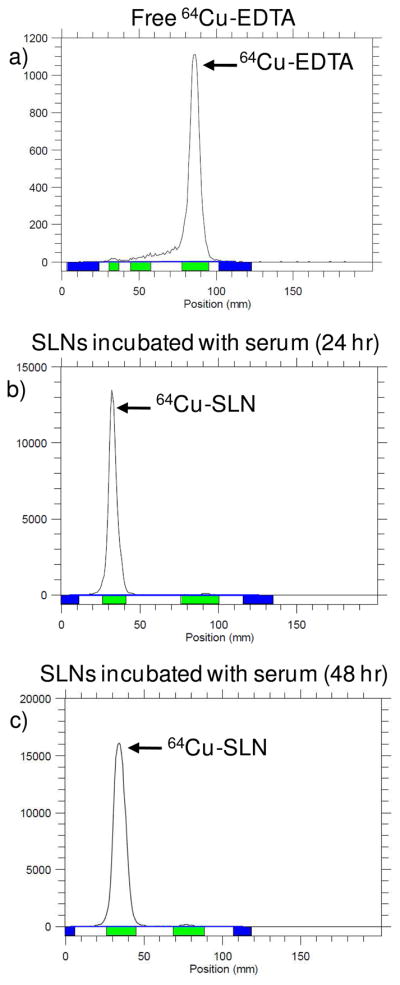
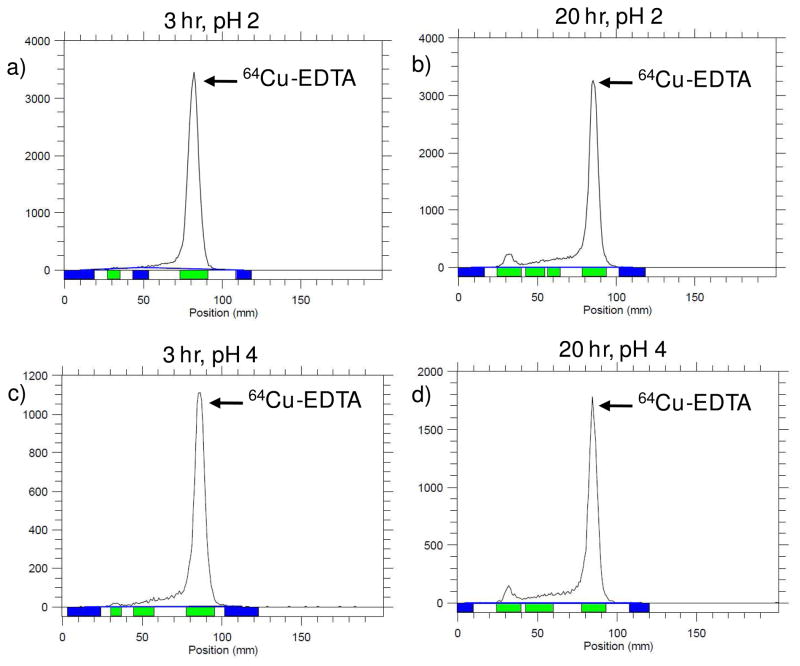
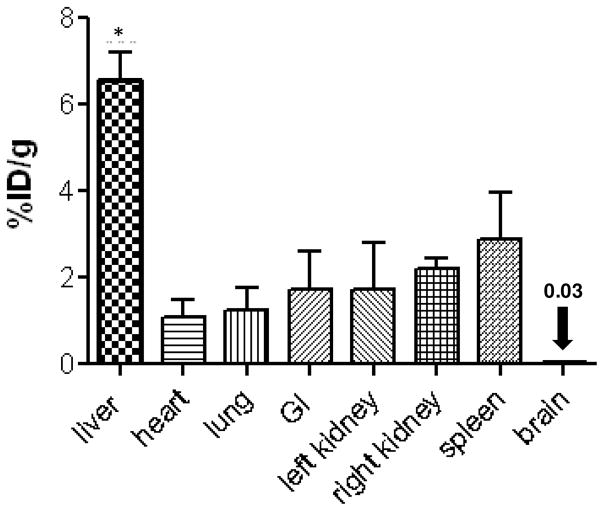
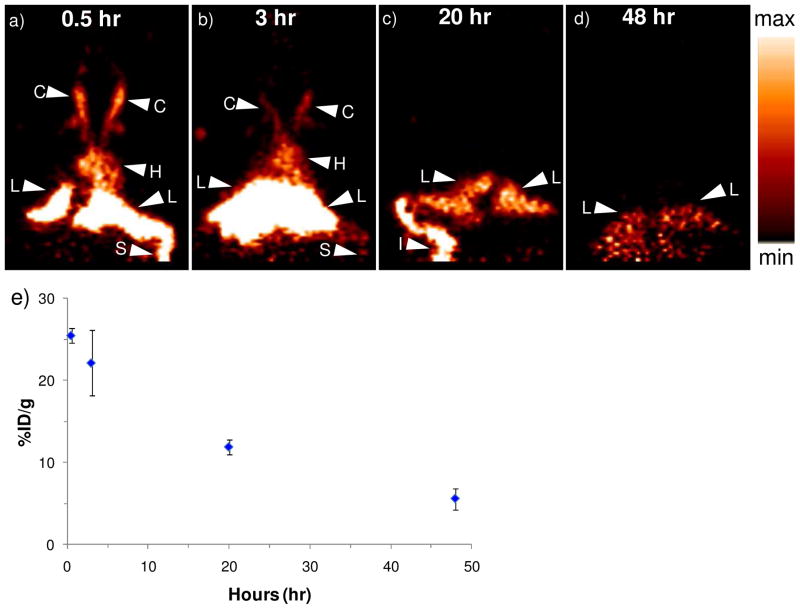
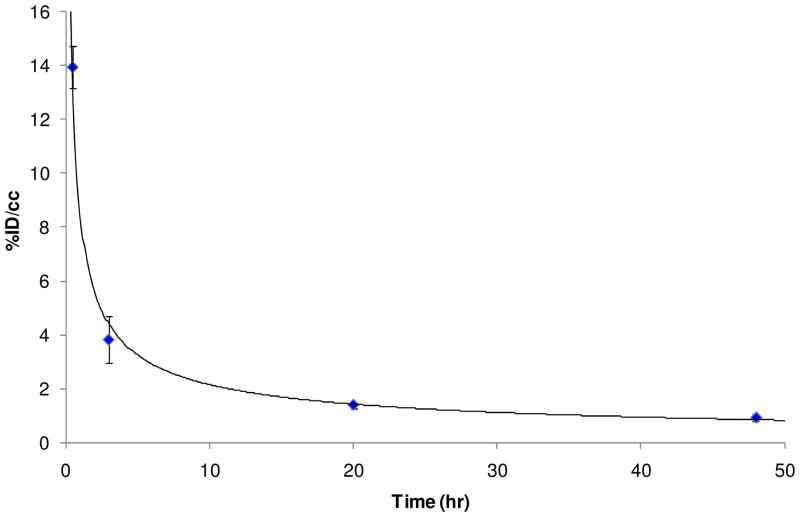
Solid lipid nanoparticles (SLNs) are submicrometer (1-1000 nm) colloidal carriers developed in the past decade as an alternative system to traditional carriers (emulsions, liposomes, and polymeric nanoparticles) for intravenous applications. Because of their potential as drug carriers, there is much interest in understanding the in vivo biodistribution of SLNs following intravenous (i.v.) injection. Positron emission tomography (PET) is an attractive method for investigating biodistribution but requires a radiolabeled compound. In this work, we describe a method to radiolabel SLN for in vivo PET studies. A copper specific chelator, 6-[p-(bromoacetamido)benzyl]-1,4,8,11-tetraazacyclotetradecane-N,N',N'',N'''-tetraacetic acid (BAT), conjugated with a synthetic lipid, was incorporated into the SLN. Following incubation with (64)CuCl(2) for 1 h at 25 °C in 0.1 M NH(4)OAc buffer (pH 5.5), the SLNs (∼150 nm) were successfully radiolabeled with (64)Cu (66.5% radiolabeling yield), exhibiting >95% radiolabeled particles following purification. The (64)Cu-SLNs were delivered intravenously to mice and imaged with PET at 0.5, 3, 20, and 48 h post injection. Gamma counting was utilized post imaging to confirm organ distributions. Tissue radioactivity (% injected dose/gram, %ID/g), obtained by quantitative analysis of the images, suggests that the (64)Cu-SLNs are circulating in the bloodstream after 3 h (blood half-life ∼1.4 h), but are almost entirely cleared by 48 h. PET and gamma counting demonstrate that approximately 5-7%ID/g (64)Cu-SLNs remain in the liver at 48 h post injection. Stability assays confirm that copper remains associated with the SLN over the 48 h time period and that the biodistribution patterns observed are not from free, dissociated copper. Our results indicate that SLNs can be radiolabeled with (64)Cu, and their biodistribution can be quantitatively evaluated by in vivo PET imaging and ex vivo gamma counting.
Figures
Similar articles
-
A novel method to label preformed liposomes with 64Cu for positron emission tomography (PET) imaging.Bioconjug Chem. 2008 Dec;19(12):2577-84. doi: 10.1021/bc8002937. Bioconjug Chem. 2008. PMID: 18991368 Free PMC article.
-
Imaging cancer using PET--the effect of the bifunctional chelator on the biodistribution of a (64)Cu-labeled antibody.Nucl Med Biol. 2011 Jan;38(1):29-38. doi: 10.1016/j.nucmedbio.2010.07.003. Epub 2010 Oct 27. Nucl Med Biol. 2011. PMID: 21220127 Free PMC article.
-
Development of Novel PSMA Ligands for Imaging and Therapy with Copper Isotopes.J Nucl Med. 2020 Jan;61(1):70-79. doi: 10.2967/jnumed.119.229054. Epub 2019 Sep 20. J Nucl Med. 2020. PMID: 31541034
-
Chelators for copper radionuclides in positron emission tomography radiopharmaceuticals.J Labelled Comp Radiopharm. 2014 Apr;57(4):224-30. doi: 10.1002/jlcr.3165. Epub 2013 Dec 18. J Labelled Comp Radiopharm. 2014. PMID: 24347474 Free PMC article. Review.
-
Radiolabeling Silica-Based Nanoparticles via Coordination Chemistry: Basic Principles, Strategies, and Applications.Acc Chem Res. 2018 Mar 20;51(3):778-788. doi: 10.1021/acs.accounts.7b00635. Epub 2018 Feb 28. Acc Chem Res. 2018. PMID: 29489335 Free PMC article. Review.
Cited by
-
Imaging of cells and nanoparticles: implications for drug delivery to the brain.Pharm Res. 2012 Dec;29(12):3213-34. doi: 10.1007/s11095-012-0826-1. Epub 2012 Jul 18. Pharm Res. 2012. PMID: 22806407 Review.
-
Liposomes to Cubosomes: The Evolution of Lipidic Nanocarriers and Their Cutting-Edge Biomedical Applications.ACS Appl Bio Mater. 2024 May 20;7(5):2677-2694. doi: 10.1021/acsabm.4c00153. Epub 2024 Apr 13. ACS Appl Bio Mater. 2024. PMID: 38613498 Free PMC article. Review.
-
Design and Characterization of Peptide-Conjugated Solid Lipid Nanoparticles for Targeted MRI and SPECT Imaging of Breast Tumors.ACS Omega. 2025 Apr 22;10(17):17310-17326. doi: 10.1021/acsomega.4c10153. eCollection 2025 May 6. ACS Omega. 2025. PMID: 40352495 Free PMC article.
-
64Cu Core-labeled nanoparticles with high specific activity via metal-free click chemistry.ACS Nano. 2012 Jun 26;6(6):5209-19. doi: 10.1021/nn300974s. Epub 2012 May 8. ACS Nano. 2012. PMID: 22548282 Free PMC article.
-
Novel multifunctional theranostic liposome drug delivery system: construction, characterization, and multimodality MR, near-infrared fluorescent, and nuclear imaging.Bioconjug Chem. 2012 Jun 20;23(6):1322-32. doi: 10.1021/bc300175d. Epub 2012 May 22. Bioconjug Chem. 2012. PMID: 22577859 Free PMC article.
References
-
- Rai S, Paliwal R, Gupta PN, Khatri K, Goyal AK, Vaidya B, Vyas SP. Solid lipid nanoparticles (SLNs) as a rising tool in drug delivery science: One step up in nanotechnology. Curr Nanosci. 2008;4:30–44.
-
- Gasco MR. Lipid nanoparticles: perspectives and challenges. Advanced Drug Delivery Reviews. 2007;59:377–378. - PubMed
Publication types
MeSH terms
Substances
Grants and funding
LinkOut - more resources
Full Text Sources
Miscellaneous
