Re-examining the relationship between audiometric profile and tinnitus pitch
- PMID: 21388238
- PMCID: PMC3082165
- DOI: 10.3109/14992027.2010.551221
Re-examining the relationship between audiometric profile and tinnitus pitch
Abstract
Objective: We explored the relationship between audiogram shape and tinnitus pitch to answer questions arising from neurophysiological models of tinnitus: 'Is the dominant tinnitus pitch associated with the edge of hearing loss?' and 'Is such a relationship more robust in people with narrow tinnitus bandwidth or steep sloping hearing loss?'
Design: A broken-stick fitting objectively quantified slope, degree and edge of hearing loss up to 16 kHz. Tinnitus pitch was characterized up to 12 kHz. We used correlation and multiple regression analyses for examining relationships with many potentially predictive audiometric variables.
Study sample: 67 people with chronic bilateral tinnitus (43 men and 24 women, aged from 22 to 81 years).
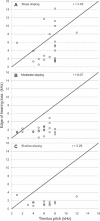
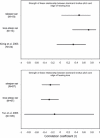
Results: In this ample of 67 subjects correlation failed to reveal any relationship between the tinnitus pitch and the edge frequency. The tinnitus pitch generally fell within the area of hearing loss. The pitch of the tinnitus in a subset of subjects with a narrow tinnitus bandwidth (n = 23) was associated with the audiometric edge.
Conclusions: Our findings concerning subjects with narrow tinnitus bandwidth suggest that this can be used as an a priori inclusion criterion. A large group of such subjects should be tested to confirm these results.
Objetivo: Exploramos la relación entre la forma del audiograma y el tono del acufeno para responder a preguntas provenientes de modelos neurofisiológicos del acúfeno: ‘Es el tono dominante del acúfeno asociado con el borde de la hipoacusia?'y ‘Será tal relación más robusta en personas con un acúfeno de banda angosta o con una hipoacusia de caída abrupta?’ Diseño: Una pendiente tipo “palo roto” objetivamente cuantificada, con severidad y borde de la hipoacusia hasta 16 kHz. El tono del acúfeno fue caracterizado hasta 12 kHz. Utiliza-mos un análisis de correlación y regresión múltiple para examinar la relación con muchas de las variables potencialmente predictivas. Muestra del Estudio: 67 personas con acúfeno bilateral crónico (43 hombres y 24 mujeres con edades entre 22 y 81 años). Resultados: En esta amplia muestra de 67 sujetos, la correlación no demostró ninguna relación entre el acúfeno y el borde de la frecuencia. El tono del acúfeno generalmente cayó dentro del área de la hipoacusia. En un subgrupo de sujetos, que tenían un acúfeno de banda angosta (n=23), si hubo asociación con el borde audiométrico. Conclusiones: Nuestros hallazgos que corresponden a los sujetos con un acúfeno de banda angosta, sugieren que esto puede ser utilizado a priori como un criterio de inclusión. Un grupo grande de sujetos debe ser examinado para confirmar estos resultados.
Figures


References
-
- Adjamian P, Sereda M, Hall DA. The mechanisms of tinnitus: Perspectives from human functional neuroimaging. Hear Res. 2009;253:15–31. - PubMed
-
- Andersson G, Baguley DM, McKenna L, McFerran D. Tinnitus: A Multidisciplinary Approach. London: Whurr Publishers Ltd; 2005.
-
- Barnea G, Attias J, Gold S, Shahar A. Tinnitus with normal hearing sensitivity: Extended high-frequency audiometry and auditory-nerve brainstem-evoked responses. Audiology. 1990;29:36–45. - PubMed
-
- Borg G, Borg E. A new generation of scaling methods: Level anchored ratio scaling. Psychologica. 2001;28:15–45.
-
- Capodaglio EM. Comparison between the CR10 Borg's scale and the VAS (visual analogue scale) during an arm-cranking exercise. J Occup Rehabil. 2001;11(2):69–74. - PubMed
MeSH terms
Grants and funding
LinkOut - more resources
Full Text Sources
Other Literature Sources
Medical
