. 2011 Aug;10(4):629-39.
doi: 10.1111/j.1474-9726.2011.00702.x. Epub 2011 Apr 25.

Fat maintenance is a predictor of the murine lifespan response to dietary restriction

Affiliations

Fat maintenance is a predictor of the murine lifespan response to dietary restriction

Chen-Yu Liao et al. Aging Cell. 2011 Aug.

Abstract

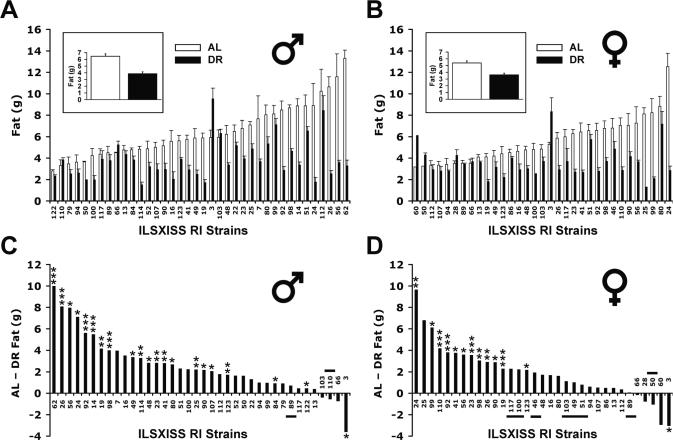
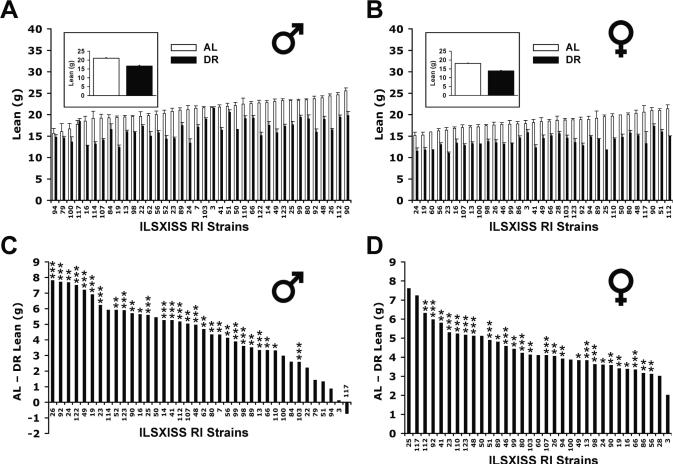
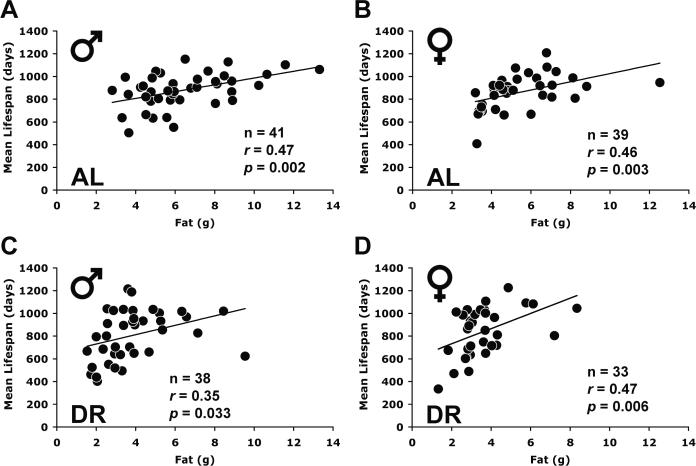
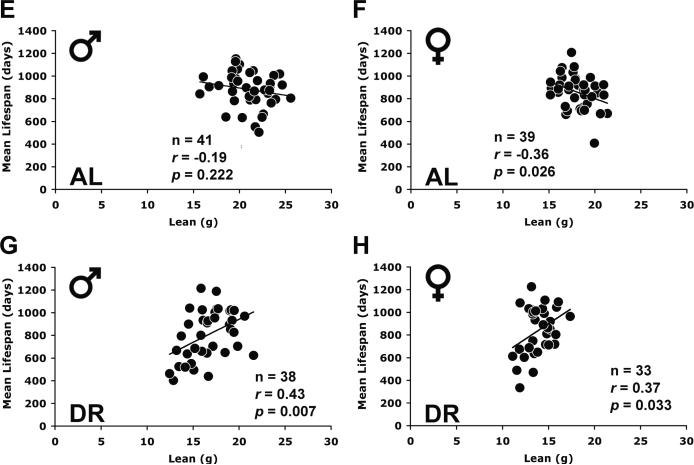
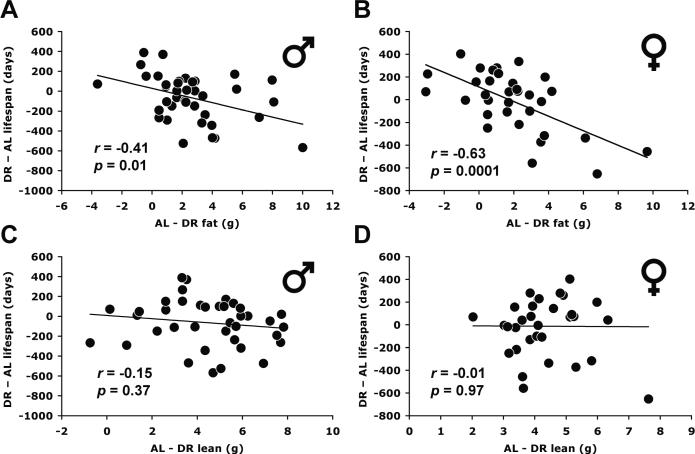
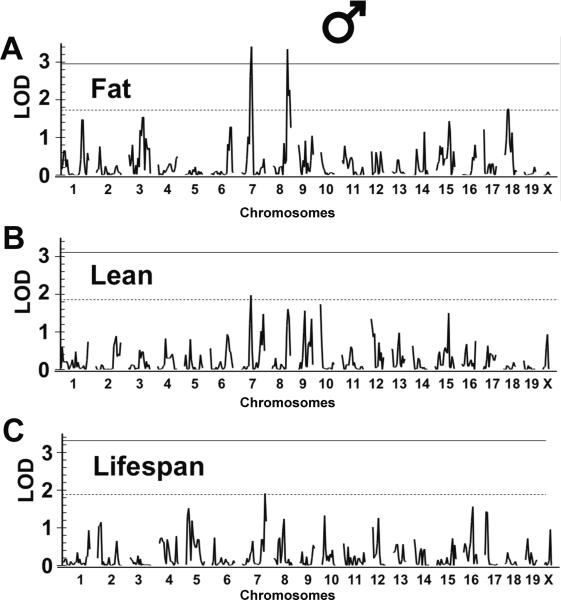
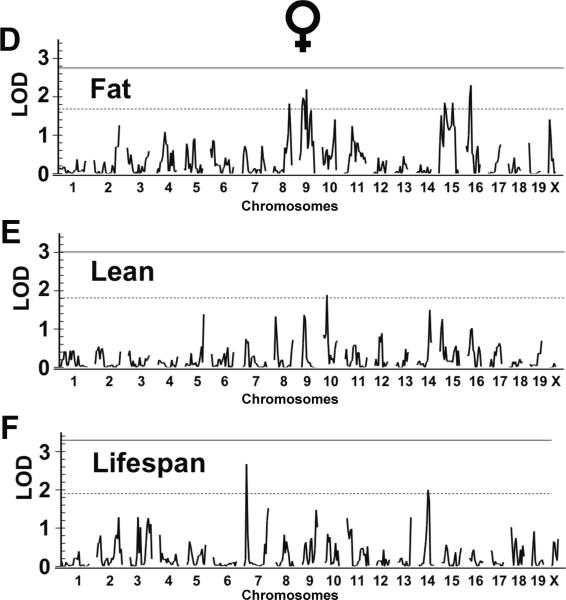
Dietary restriction (DR), one of the most robust life-extending manipulations, is usually associated with reduced adiposity. This reduction is hypothesized to be important in the life-extending effect of DR, because excess adiposity is associated with metabolic and age-related disease. Previously, we described remarkable variation in the lifespan response of 41 recombinant inbred strains of mice to DR, ranging from life extension to life shortening. Here, we used this variation to determine the relationship of lifespan modulation under DR to fat loss. Across strains, DR life extension correlated inversely with fat reduction, measured at midlife (males, r= -0.41, P<0.05, n=38 strains; females, r= -0.63, P<0.001, n=33 strains) and later ages. Thus, strains with the least reduction in fat were more likely to show life extension, and those with the greatest reduction were more likely to have shortened lifespan. We identified two significant quantitative trait loci (QTLs) affecting fat mass under DR in males but none for lifespan, precluding the confirmation of these loci as coordinate modulators of adiposity and longevity. Our data also provide evidence for a QTL previously shown to affect fuel efficiency under DR. In summary, the data do not support an important role for fat reduction in life extension by DR. They suggest instead that factors associated with maintaining adiposity are important for survival and life extension under DR.


Figures

Fig. 1
Fig. 1
Strain variation in fat mass of ILSXISS recombinant inbred (RI) mice under ad libitum (AL) and 40% dietary restriction (DR) diets. Fat mass was obtained using quantitative magnetic resonance (QMR) from ILSXISS recombinant inbred (RI) mice aged 15–17 months after they were under AL or DR diet since 2–5 months of age. Mean fat mass in the upper two panels is shown for each strain [AL (□) and DR (■)], ranked in ascending order according to the AL means (A. males, 38 strains; B. females, 33 strains). Insets in panel A and B: the mean fat mass of all strains. Panels C (males) and D (females) illustrate the difference of fat mass between AL and DR groups, ranked from the strain with the greatest reduction in fat mass under DR to the strain with the least reduction (* p < 0.05, ** p < 0.01, *** p < 0.001 by t-test; no experiment-wise Bonferroni correction). The strains that showed significantly increased lifespan under DR (Liao et al., 2010a) are underlined or overlined. Error bars represent SEM.
Fig. 2
Fig. 2
Strain variation in lean mass of ILSXISS recombinant inbred (RI) mice under ad libitum (AL) and 40% dietary restriction (DR) diets. Lean mass was obtained using quantitative magnetic resonance (QMR) from ILSXISS recombinant inbred (RI) mice aged 15–17 months after they were under AL or DR diet since 2–5 months of age. The mean lean mass in the upper two panels are shown for each strain [AL (□) and DR (■)], ranked in ascending order according to the AL means (A. males, 38 strains; B. females, 33 strains). Insets in panel A and B: the mean lean mass of all strains. Panels C (males) and D (females) illustrate the difference of lean mass between AL and DR, ranked from the strain with the greatest reduction in lean mass under DR to the strain with the least reduction (* p < 0.05, ** p < 0.01, *** p < 0.001 by t-test; no experiment-wise Bonferroni correction). Error bars represent SEM.
Fig. 3
Fig. 3
Scattergram showing the correlation between absolute fat mass, lean mass and lifespan in ad libitum (AL) and 40% dietary restriction (DR) diets for mice aged 15–17 months. Mean values of each ILSXISS recombinant inbred (RI) strain (A, C, E, G: males; B, D, F, H: females) are shown. Mean lifespan was derived from Liao et al. (2010a). The lines represent linear regression. The P values of the Pearson correlation coefficients (r) are all from 2-tailed tests. n: number of strains.
Fig. 3
Fig. 3
Scattergram showing the correlation between absolute fat mass, lean mass and lifespan in ad libitum (AL) and 40% dietary restriction (DR) diets for mice aged 15–17 months. Mean values of each ILSXISS recombinant inbred (RI) strain (A, C, E, G: males; B, D, F, H: females) are shown. Mean lifespan was derived from Liao et al. (2010a). The lines represent linear regression. The P values of the Pearson correlation coefficients (r) are all from 2-tailed tests. n: number of strains.
Fig. 4
Fig. 4
Correlation between fat reduction and lifespan modulation under 40% dietary restriction (DR). X-axis: fat (or lean) reduction was measured by subtracting fat (or lean) mass under DR from fat (or lean) mass under AL feeding for each strain. Y-axis: lifespan modulation was measured by subtracting mean lifespan under AL from mean lifespan under DR (Liao et al., 2010a). Fat and lean mass were derived from 15–17 months of age. Reduction in lean body mass was not correlated with differential lifespan (C: males; D: females). The lines represent linear regression. The P values of the Pearson correlation coefficients (r) are all from 2-tailed tests.
Fig. 5
Fig. 5
Quantitative trait loci (QTL) mapping for specific dietary restriction (DR) effects. QTL mapping for fat (A & D), lean (B & E) and lifespan (C & F) response to DR were screened across the genome for the ILSXISS recombinant inbred (RI) strains aged 15–17 months after they were under AL or DR diet since 2–5 months of age. Chromosome location is on the x–axis, and logarithm of odds (LOD) score is on the y–axis. Solid lines and dash lines indicate the genome-wide significant (P < 0.05) and suggestive (P < 0.63) threshold of LOD, respectively, as determined by permutation tests using 10,000 permutations.
Fig. 5
Fig. 5
Quantitative trait loci (QTL) mapping for specific dietary restriction (DR) effects. QTL mapping for fat (A & D), lean (B & E) and lifespan (C & F) response to DR were screened across the genome for the ILSXISS recombinant inbred (RI) strains aged 15–17 months after they were under AL or DR diet since 2–5 months of age. Chromosome location is on the x–axis, and logarithm of odds (LOD) score is on the y–axis. Solid lines and dash lines indicate the genome-wide significant (P < 0.05) and suggestive (P < 0.63) threshold of LOD, respectively, as determined by permutation tests using 10,000 permutations.

References

    1. Abiola O, Angel JM, Avner P, Bachmanov AA, Belknap JK, Bennett B, Blankenhorn EP, Blizard DA, Bolivar V, Brockmann GA, et al. The nature and identification of quantitative trait loci: a community's view. Nat Rev Genet. 2003;4:911–916. - PMC - PubMed
    1. Barzilai N. Author's response to commentary on “Revisiting the role of fat mass in the life extension induced by caloric restriction”. J Gerontol A Biol Sci Med Sci. 1999;54:B98. - PubMed
    1. Barzilai N, Banerjee S, Hawkins M, Chen W, Rossetti L. Caloric restriction reverses hepatic insulin resistance in aging rats by decreasing visceral fat. Journal of Clinical Investigation. 1998;101:1353–1361. - PMC - PubMed
    1. Barzilai N, Gabriely I. The role of fat depletion in the biological benefits of caloric restriction. J Nutr. 2001;131:903S–906S. - PubMed
    1. Barzilai N, Gupta G. Revisiting the role of fat mass in the life extension induced by caloric restriction. J Gerontol A Biol Sci Med Sci. 1999;54:B89–96. discussion B97–88. - PubMed

Publication types