

Spectral domain optical coherence tomography imaging of drusen in nonexudative age-related macular degeneration
- PMID: 21388687
- PMCID: PMC3129493
- DOI: 10.1016/j.ophtha.2010.11.013
Spectral domain optical coherence tomography imaging of drusen in nonexudative age-related macular degeneration
Abstract
Purpose: To measure drusen area and volume in eyes with nonexudative age-related macular degeneration (AMD) using spectral domain optical coherence tomography imaging (SD-OCT).
Design: Evaluation of diagnostic technology.
Participants: One hundred three eyes from 74 patients with drusen.
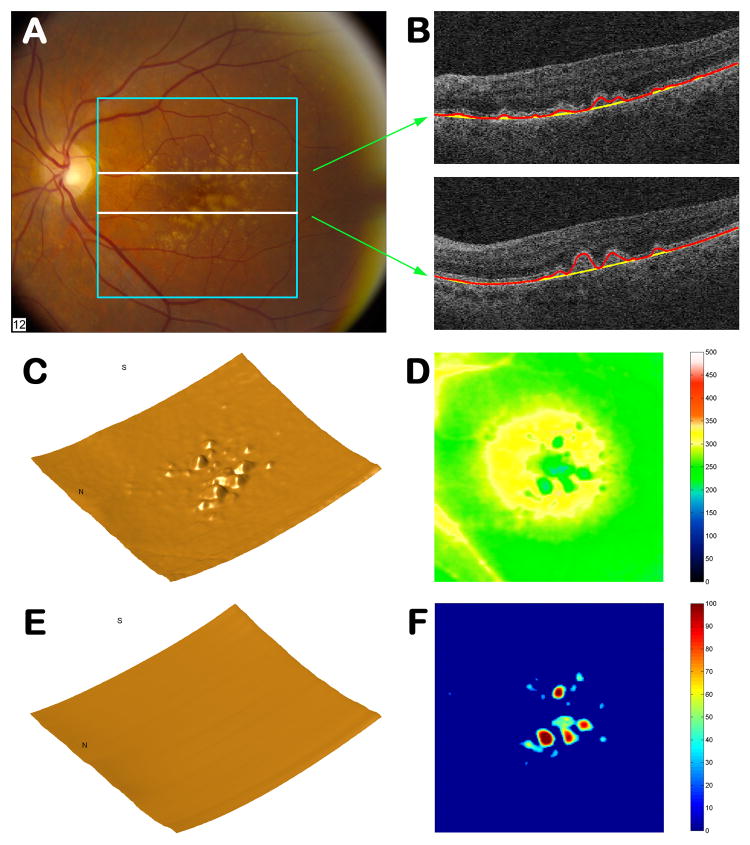
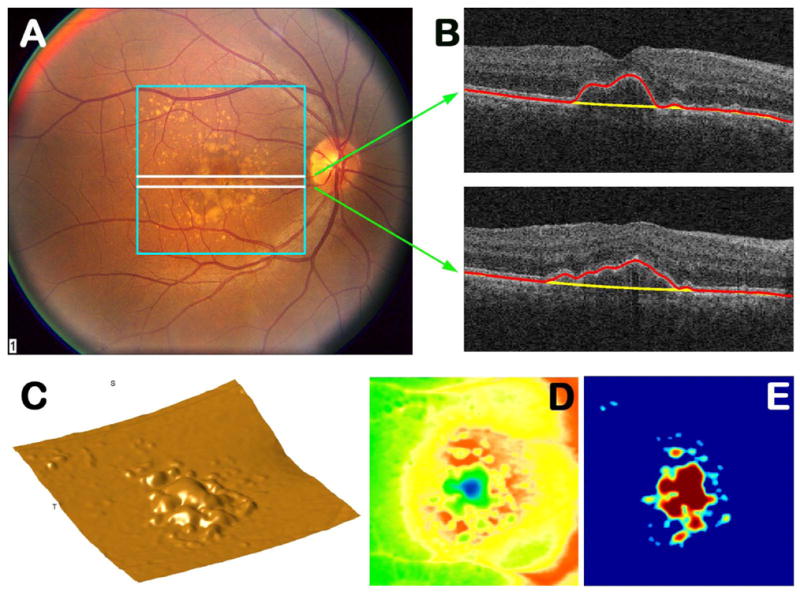
Methods: Patients with drusen secondary to nonexudative AMD were enrolled in this study. Five separate SD-OCT scans, each consisting of 40 000 uniformly spaced A-scans organized as 200 A-scans in each B-scan and 200 horizontal B-scans, were performed on each eye. Each scan covered a retinal area of 6×6 mm centered on the fovea. A novel algorithm was used to quantitatively assess drusen area and volume. Measurements from the entire scans, as well as in regions contained within 3- and 5-mm circles centered on the fovea, were analyzed. Test-retest standard deviations of drusen area and volume measurements were calculated for each eye.
Main outcome measures: Drusen area and volume.
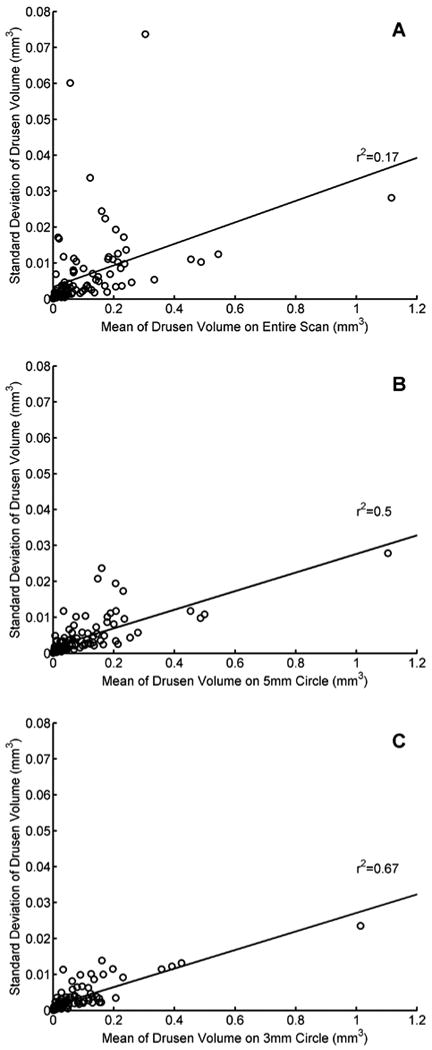
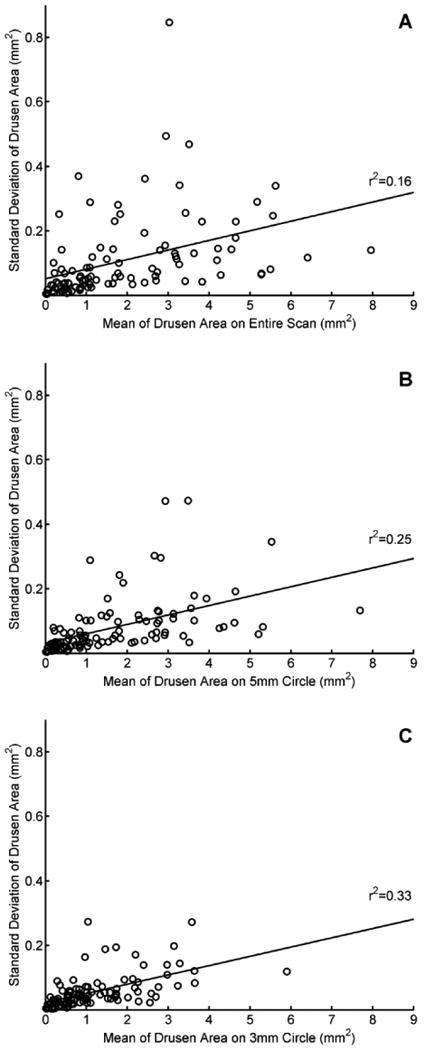
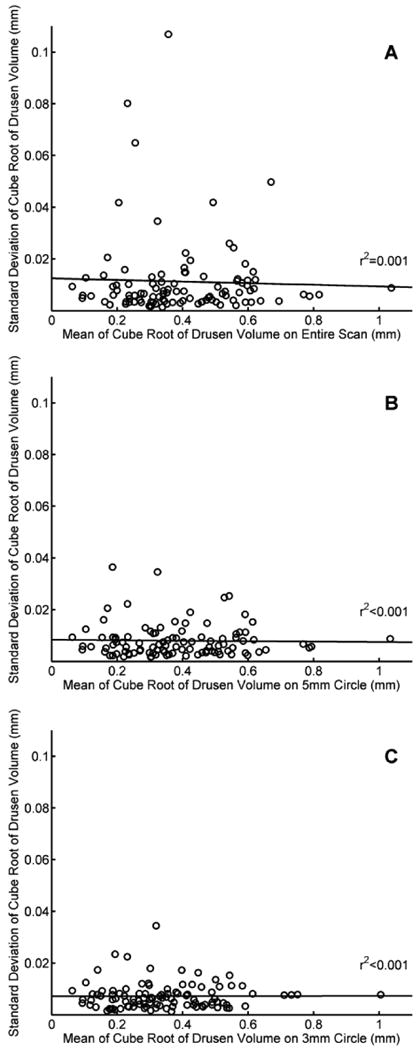
Results: The algorithm created drusen maps that permitted both qualitative and quantitative assessment of drusen area and volume. Both the qualitative appearance and the quantitative measurements of drusen area and volume were highly reproducible over the 5 different datasets. The intraclass correlation coefficient was >0.99 for both area and volume measurements on the entire dataset as well as the 3- and 5-mm circles. The correlation between lesion size and the test-retest standard deviations can be eliminated by performing a square root transformation of the area measurements and a cube root transformation of the volume measurements. These transformed data allowed for the inclusion of all drusen sizes in the calculation of an estimated single pooled test-retest standard deviation, which will be useful for longitudinal studies of drusen natural history.
Conclusions: A novel algorithm for the qualitative and quantitative assessment of drusen imaged using SD-OCT was shown to be highly reproducible. The ability to assess drusen volume reliably represents a new quantitative parameter to measure in AMD and may be useful when assessing disease progression, particularly in trials for treatments of nonexudative AMD.
Copyright © 2011 American Academy of Ophthalmology. Published by Elsevier Inc. All rights reserved.
Figures


Similar articles
-
Natural history of drusen morphology in age-related macular degeneration using spectral domain optical coherence tomography.Ophthalmology. 2011 Dec;118(12):2434-41. doi: 10.1016/j.ophtha.2011.05.008. Epub 2011 Jul 2. Ophthalmology. 2011. PMID: 21724264 Free PMC article.
-
Drusen Volume as a Predictor of Disease Progression in Patients With Late Age-Related Macular Degeneration in the Fellow Eye.Invest Ophthalmol Vis Sci. 2016 Apr;57(4):1839-46. doi: 10.1167/iovs.15-18572. Invest Ophthalmol Vis Sci. 2016. PMID: 27082298
-
Quantitative imaging of retinal pigment epithelial detachments using spectral-domain optical coherence tomography.Am J Ophthalmol. 2012 Mar;153(3):515-23. doi: 10.1016/j.ajo.2011.08.031. Epub 2011 Oct 25. Am J Ophthalmol. 2012. PMID: 22030354
-
Anatomic Clinical Trial Endpoints for Nonexudative Age-Related Macular Degeneration.Ophthalmology. 2016 May;123(5):1060-79. doi: 10.1016/j.ophtha.2016.01.034. Epub 2016 Mar 5. Ophthalmology. 2016. PMID: 26952592 Review.
-
Spectral domain optical coherence tomography imaging of dry age-related macular degeneration.Ophthalmic Surg Lasers Imaging. 2010 Nov-Dec;41 Suppl:S6-S14. doi: 10.3928/15428877-20101031-19. Ophthalmic Surg Lasers Imaging. 2010. PMID: 21117603 Review.
Cited by
-
Treating patients with geographic atrophy: are we there yet?Int J Retina Vitreous. 2023 Nov 20;9(1):72. doi: 10.1186/s40942-023-00493-6. Int J Retina Vitreous. 2023. PMID: 37986170 Free PMC article. Review.
-
Association of Visual Function Measures with Drusen Volume in Early Stages of Age-Related Macular Degeneration.Invest Ophthalmol Vis Sci. 2020 Mar 9;61(3):55. doi: 10.1167/iovs.61.3.55. Invest Ophthalmol Vis Sci. 2020. PMID: 32232348 Free PMC article.
-
Machine learning based detection of age-related macular degeneration (AMD) and diabetic macular edema (DME) from optical coherence tomography (OCT) images.Biomed Opt Express. 2016 Nov 3;7(12):4928-4940. doi: 10.1364/BOE.7.004928. eCollection 2016 Dec 1. Biomed Opt Express. 2016. PMID: 28018716 Free PMC article.
-
Association of OCT derived drusen measurements with AMD associated-genotypic SNPs in Amish population.J Clin Med. 2015;4(2):304-317. doi: 10.3390/jcm4020304. J Clin Med. 2015. PMID: 25893111 Free PMC article.
-
Relationship between systemic cytokines and complement factor H Y402H polymorphism in patients with dry age-related macular degeneration.Am J Ophthalmol. 2013 Dec;156(6):1176-83. doi: 10.1016/j.ajo.2013.08.003. Epub 2013 Sep 29. Am J Ophthalmol. 2013. PMID: 24083687 Free PMC article.
References
-
- Seddon JM, Sharma S, Adelman RA. Evaluation of the Clinical Age-Related Maculopathy Staging system. Ophthalmology. 2006;113:260–6. - PubMed
-
- Mitchell P, Foran S. Age-Related Eye Disease Study severity scale and simplified severity scale for age-related macular degeneration. Arch Ophthalmol. 2005;123:1598–9. - PubMed
-
- Bartlett H, Eperjesi F. Use of fundus imaging in quantification of age-related macular change. Surv Ophthalmol. 2007;52:655–71. - PubMed
-
- Klein R, Davis MD, Magli YL, et al. The Wisconsin Age-Related Maculopathy Grading System. Ophthalmology. 1991;98:1128–34. - PubMed
Publication types
MeSH terms
Grants and funding
LinkOut - more resources
Full Text Sources
Other Literature Sources
Medical
