

Binding between insulin-like growth factor 1 and insulin-like growth factor-binding protein 3 is not influenced by glucose or 2-deoxy-D-glucose
- PMID: 21388950
- PMCID: PMC3089499
- DOI: 10.1074/jbc.M110.213033
Binding between insulin-like growth factor 1 and insulin-like growth factor-binding protein 3 is not influenced by glucose or 2-deoxy-D-glucose
Abstract
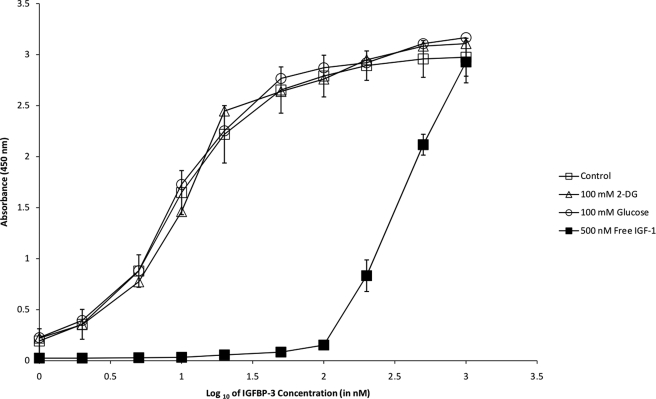
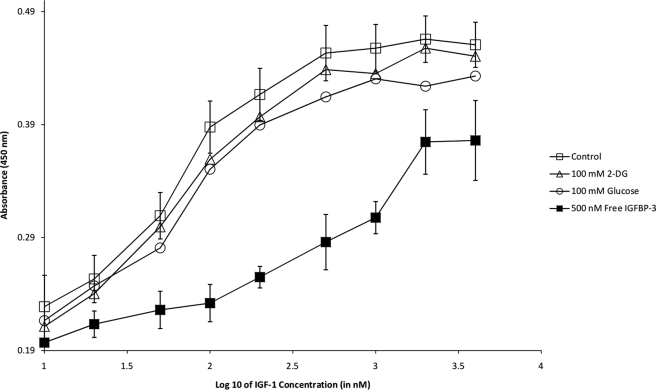
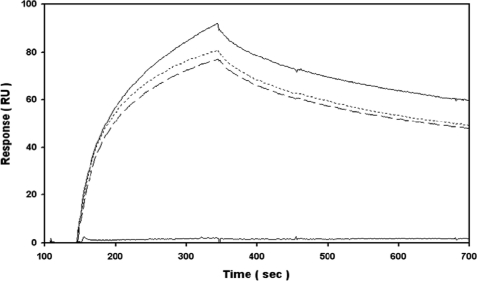
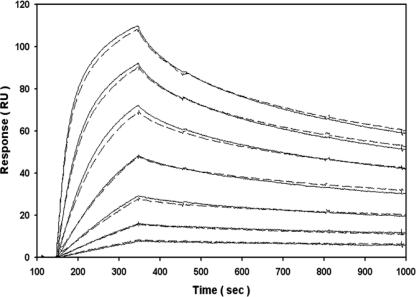
A recent report (Zhong, D., Xiong, L., Liu, T., Liu, X., Liu, X., Chen, J., Sun, S. Y., Khuri, F. R., Zong, Y., Zhou, Q., and Zhou, W. (2009) J. Biol. Chem. 284, 23225-23233) details that 2-deoxy-D-glucose (2-DG), a well known inhibitor of glycolysis and a candidate antineoplastic agent, also induces insulin-like growth factor 1 receptor (IGF-1R) signaling through the inhibition of insulin-like growth factor 1-insulin-like growth factor-binding protein 3 (IGF-1-IGFBP-3) complex formation. Zhong et al. hypothesized that disrupted IGF-1/IGFBP-3 binding by 2-DG led to increased free IGF-1 concentrations and, consequently, activation of IGF-1R downstream pathways. Because their report suggests unprecedented off-target effects of 2-DG, this has profound implications for the fields of metabolism and oncology. Using ELISA, surface plasmon resonance, and novel "intensity-fading" mass spectrometry, we now provide a detailed characterization of complex formation between IGF-1 and IGFBP-3. All three of these independent methods demonstrated that there was no effect of glucose or 2-DG on the interaction between IGF-1 and IGFBP-3. Furthermore, we show examples of 2-DG exposure associated with reduced rather than increased IGF-1R and AKT activation, providing further evidence against a 2-DG increase in IGF-1R activation by IGF-1-IGFBP-3 complex disruption.
Figures


Similar articles
-
Synthesis and characterization of biotinylated forms of insulin-like growth factor-1: topographical evaluation of the IGF-1/IGFBP-2 AND IGFBP-3 interface.Biochemistry. 2004 Sep 14;43(36):11533-45. doi: 10.1021/bi049082k. Biochemistry. 2004. PMID: 15350139
-
Paradoxical effects of the phage display-derived peptide antagonist IGF-F1-1 on insulin-like growth factor-1 receptor signaling.Biochem Pharmacol. 2006 Jun 28;72(1):53-61. doi: 10.1016/j.bcp.2006.03.025. Epub 2006 Apr 18. Biochem Pharmacol. 2006. PMID: 16684509
-
High expression of insulin-like growth factor binding protein-3 is correlated with lower portal invasion and better prognosis in human hepatocellular carcinoma.Cancer Sci. 2006 Nov;97(11):1182-90. doi: 10.1111/j.1349-7006.2006.00322.x. Epub 2006 Sep 12. Cancer Sci. 2006. PMID: 16965600 Free PMC article.
-
Vitamin D and the insulin-like growth factor system: Implications for colorectal neoplasia.Eur J Clin Invest. 2020 Sep;50(9):e13265. doi: 10.1111/eci.13265. Epub 2020 May 24. Eur J Clin Invest. 2020. PMID: 32379895 Review.
-
Targeting insulin-like growth factor-I and insulin-like growth factor-binding protein-3 signaling pathways. A novel therapeutic approach for asthma.Am J Respir Cell Mol Biol. 2014 Apr;50(4):667-77. doi: 10.1165/rcmb.2013-0397TR. Am J Respir Cell Mol Biol. 2014. PMID: 24219511 Free PMC article. Review.
Cited by
-
Low Glycolysis Is Neuroprotective during Anoxic Spreading Depolarization (SD) and Reoxygenation in Locusts.eNeuro. 2023 Nov 27;10(11):ENEURO.0325-23.2023. doi: 10.1523/ENEURO.0325-23.2023. Print 2023 Nov. eNeuro. 2023. PMID: 37932046 Free PMC article.
-
Resveratrol augments ER stress and the cytotoxic effects of glycolytic inhibition in neuroblastoma by downregulating Akt in a mechanism independent of SIRT1.Exp Mol Med. 2016 Feb 19;48(2):e210. doi: 10.1038/emm.2015.116. Exp Mol Med. 2016. PMID: 26891914 Free PMC article.
-
VHL-deficient renal cancer cells gain resistance to mitochondria-activating apoptosis inducers by activating AKT through the IGF1R-PI3K pathway.Tumour Biol. 2016 Oct;37(10):13295-13306. doi: 10.1007/s13277-016-5260-2. Epub 2016 Jul 26. Tumour Biol. 2016. PMID: 27460078 Free PMC article.
-
Cell Communication Network factor 4 promotes tumor-induced immunosuppression in melanoma.EMBO Rep. 2022 Apr 5;23(4):e54127. doi: 10.15252/embr.202154127. Epub 2022 Jan 31. EMBO Rep. 2022. PMID: 35099839 Free PMC article.
-
Inhibition of IGF1R enhances 2-deoxyglucose in the treatment of non-small cell lung cancer.Lung Cancer. 2018 Sep;123:36-43. doi: 10.1016/j.lungcan.2018.06.026. Epub 2018 Jun 23. Lung Cancer. 2018. PMID: 30089593 Free PMC article.
References
-
- Pollak M. (2008) Nat. Rev. Cancer 8, 915–928 - PubMed
-
- Laviola L., Natalicchio A., Giorgino F. (2007) Curr. Pharm. Des. 13, 663–669 - PubMed
-
- Collett-Solberg P. F., Cohen P. (2000) Endocrine 12, 121–136 - PubMed
-
- Vincent A. M., Feldman E. L. (2002) Growth Horm. IGF Res. 12, 193–197 - PubMed
-
- LeRoith D., Roberts C. T., Jr. (2003) Cancer Lett. 195, 127–137 - PubMed
MeSH terms
Substances
LinkOut - more resources
Full Text Sources
Other Literature Sources
Miscellaneous
