. 2011 Mar 9;31(10):3589-601.
doi: 10.1523/JNEUROSCI.4310-10.2011.

Spatiotemporal properties of neuron response suppression in owl monkey primary somatosensory cortex when stimuli are presented to both hands

Affiliations

Spatiotemporal properties of neuron response suppression in owl monkey primary somatosensory cortex when stimuli are presented to both hands

Jamie L Reed et al. J Neurosci. .

Abstract

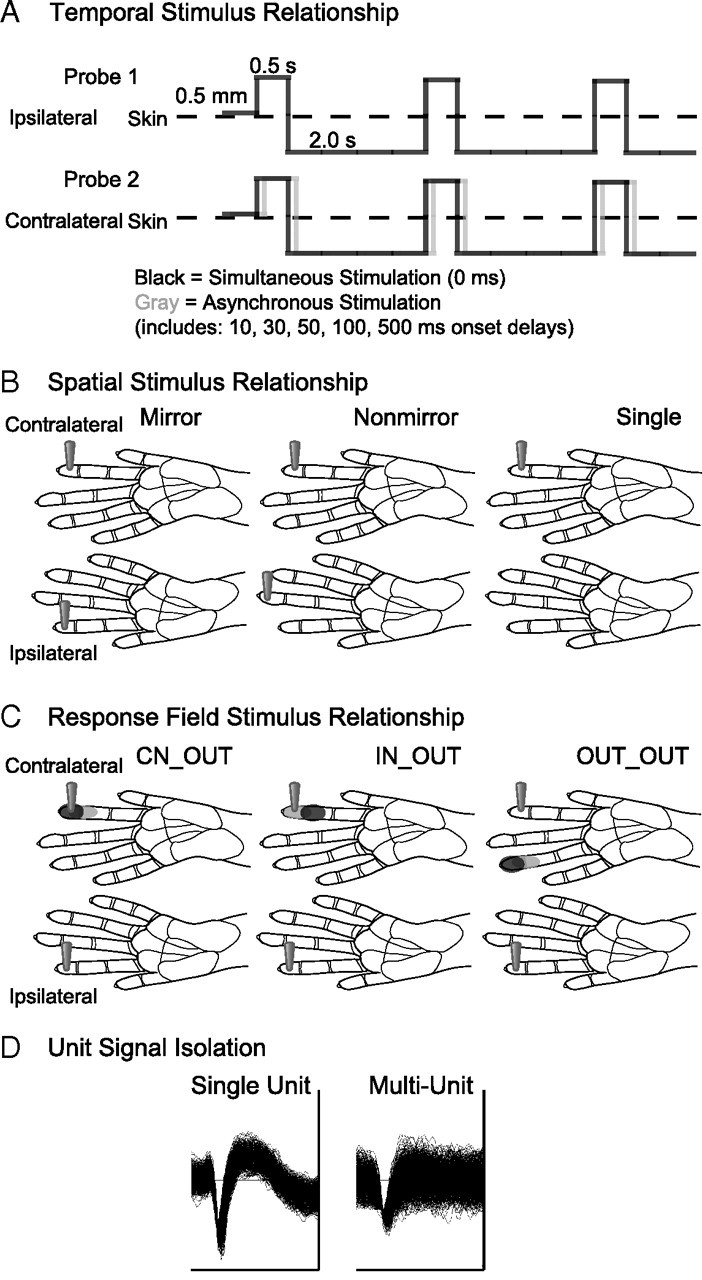
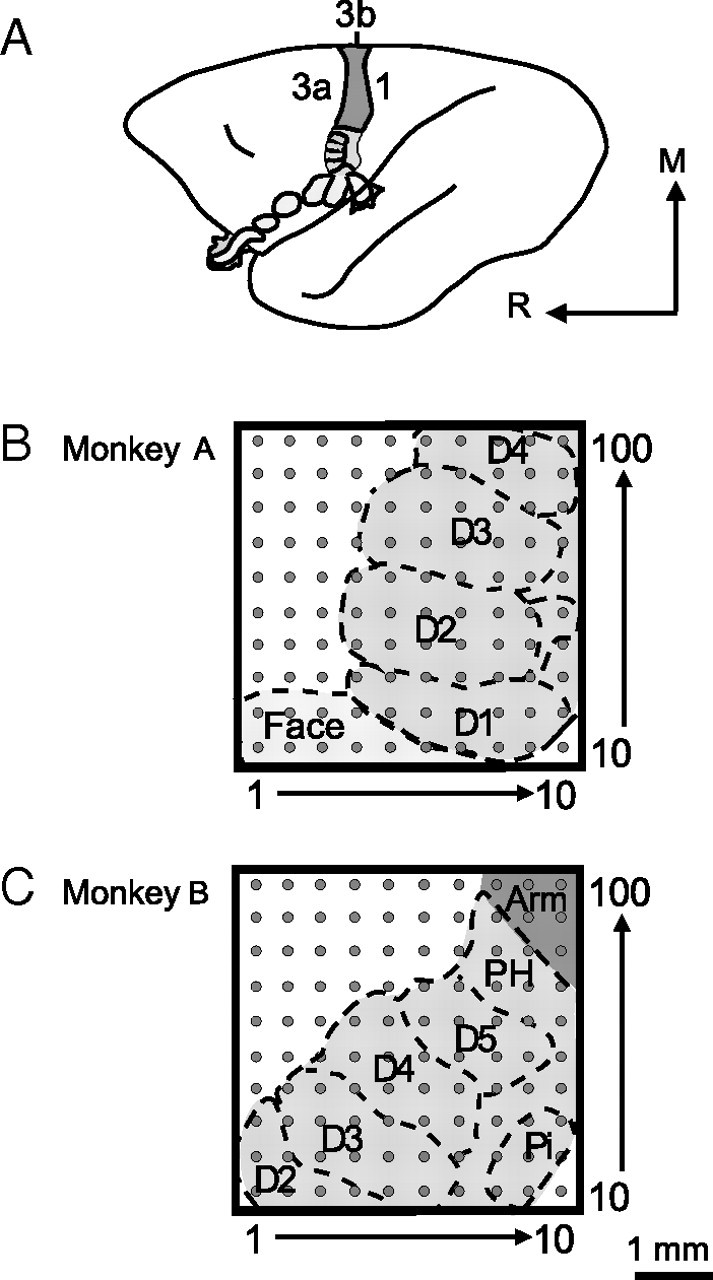
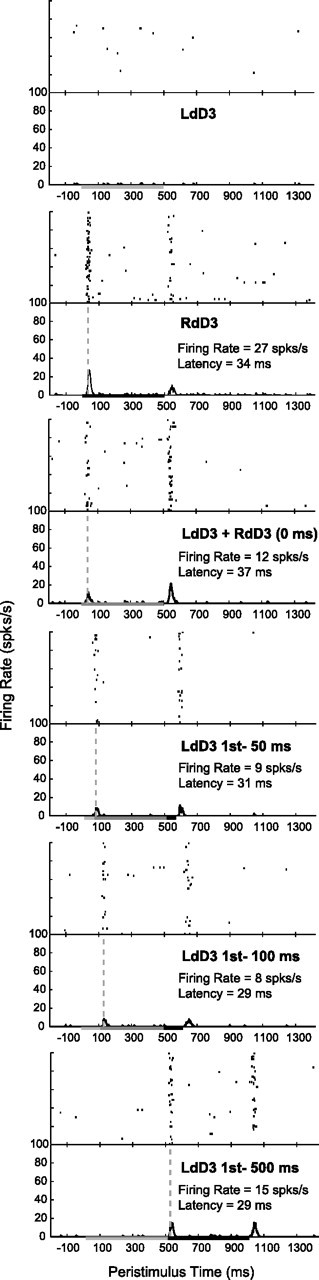
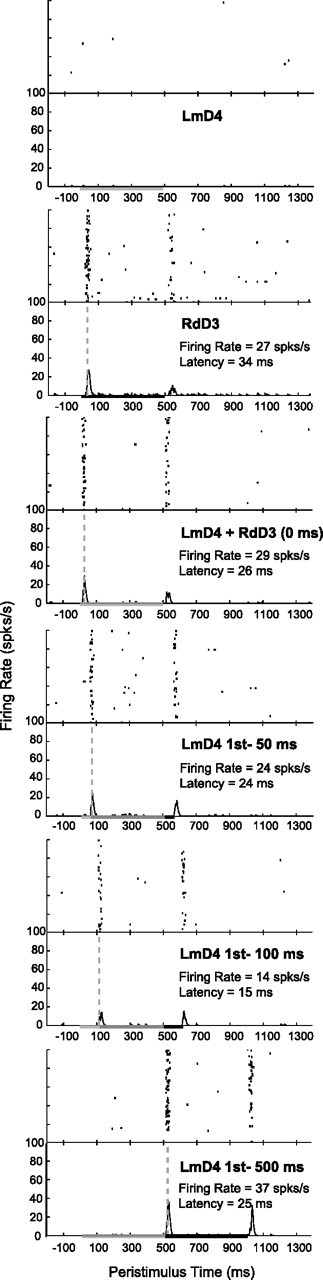
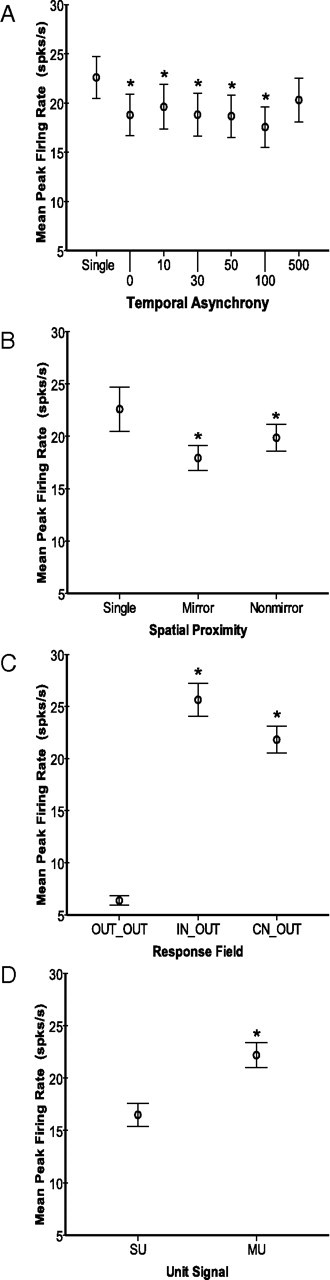
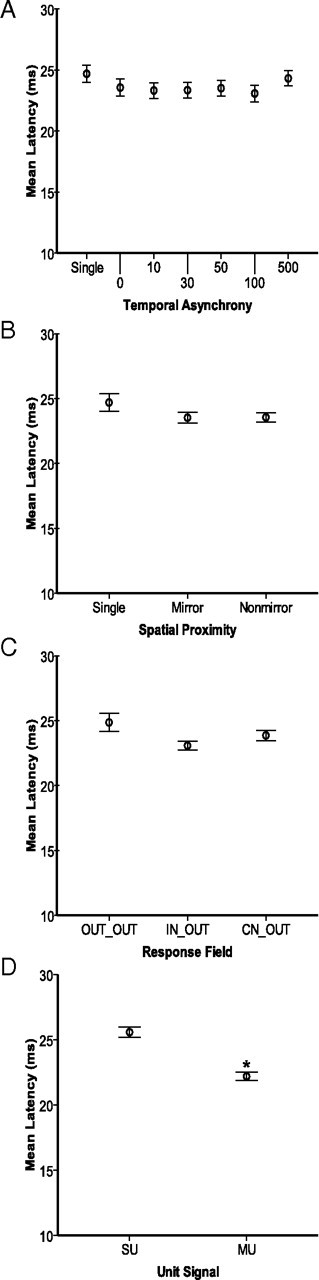
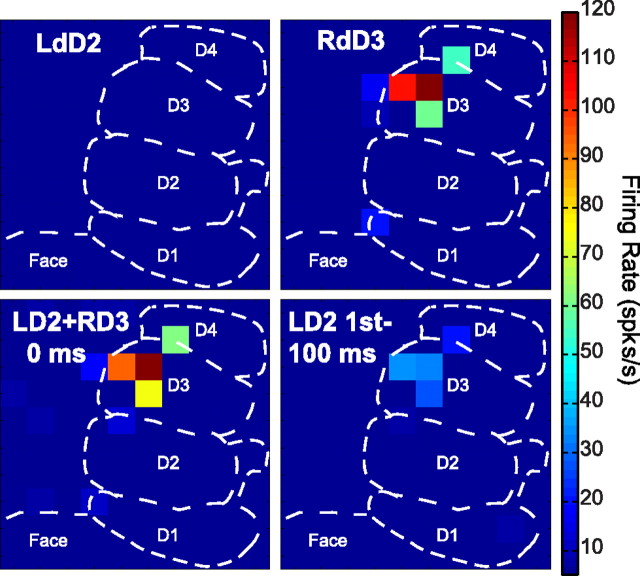
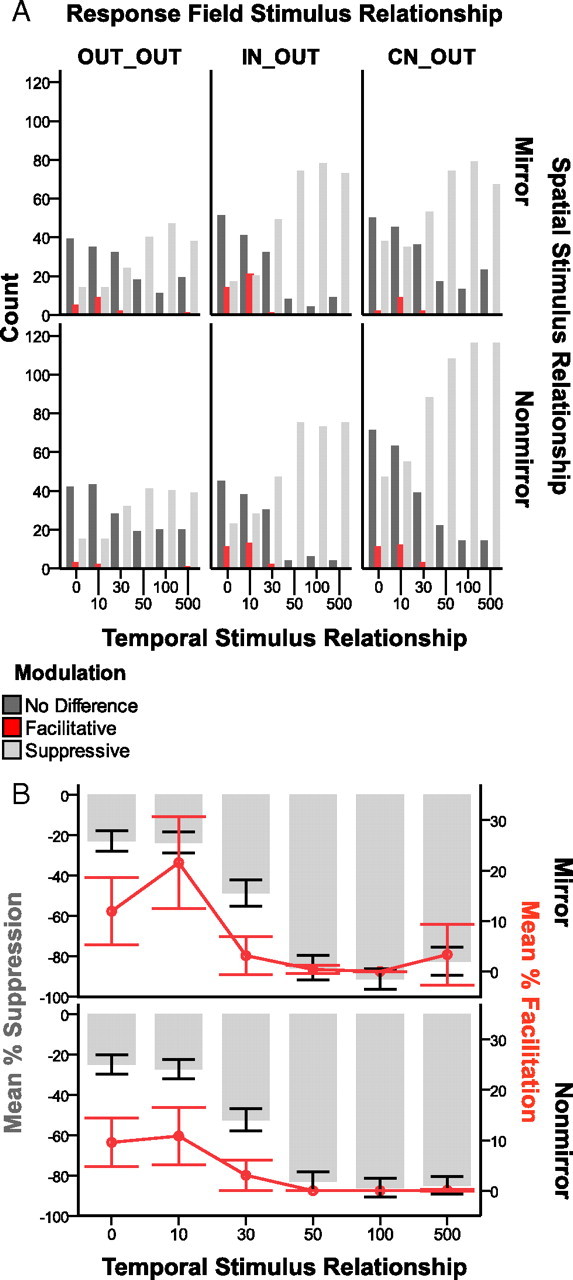
Despite the lack of ipsilateral receptive fields (RFs) for neurons in the hand representation of area 3b of primary somatosensory cortex, interhemispheric interactions have been reported to varying degrees. We investigated spatiotemporal properties of these interactions to determine the following: response types, timing between stimuli to evoke the strongest bimanual interactions, topographical distribution of effects, and their dependence on similarity of stimulus locations on the two hands. We analyzed response magnitudes and latencies of single neurons and multineuron clusters recorded from 100-electrode arrays implanted in one hemisphere of each of two anesthetized owl monkeys. Skin indentations were delivered to the two hands simultaneously and asynchronously at mirror locations (matched sites on each hand) and nonmirror locations. Since multiple neurons were recorded simultaneously, stimuli on the contralateral hand could be within or outside of the classical RFs of any given neuron. For most neurons, stimulation on the ipsilateral hand suppressed responses to stimuli on the contralateral hand. Maximum suppression occurred when the ipsilateral stimulus was presented 100 ms before the contralateral stimulus onset (p < 0.0005). The longest stimulus onset delay tested (500 ms) allowed contralateral responses to recover to control levels (p = 0.428). Stimulation on mirror digits did not differ from stimulation on nonmirror locations (p = 1.000). These results indicate that interhemispheric interactions are common in area 3b, somewhat topographically diffuse, and maximal when the suppressing ipsilateral stimulus precedes the contralateral stimulus. Our findings point to a neurophysiological basis for "interference" effects found in human psychophysical studies of bimanual stimulation.


Figures

Figure 1.
Figure 1.
Schematic representations of data categories for analysis. A, The temporal pattern of stimulation is depicted by solid lines indicating the duration that the stimulus probe indents the skin (0.5 s), the depth of indentation (0.5 mm), and the duration the stimulus probe is off the skin per stimulus cycle (2.0 s). Paired stimulation, indicated by the schematics of Probe 1 and Probe 2, was simultaneous or asynchronous. To depict asynchronous stimulation generally, the gray solid line representing Probe 2 is shifted relative to the black solid line. The two probes are presented to different skin sites on the hand; however, the schematic depicts the overlap in contact time of the stimuli presented via Probe 1 and Probe 2. B, The spatial stimulus relationships were divided into three categories, illustrated by the locations of the stimulus probes on schematics of the owl monkey hands for dual probes on two hands (mirror and nonmirror locations) and a single probe on one hand as a control category. C, The response field category is determined by the response field of the unit relative to the stimulation location. Black shading on schematics of the owl monkey hand indicates the center of the response field for a hypothetical unit. Gray shading on the hand indicates locations inside the response field, but outside the center “hotspot” for the hypothetical reference unit. The locations of the two probes indicate the location of the stimulation relative to the response field for each response field category. D, Data were also classified by the quality of the signal isolation into single units or multiunits. Examples of each unit type are shown from monkey case B. The trace window for each unit shown span 128 μV and 1.6 ms.
Figure 2.
Figure 2.
Schematic reconstructions show 100-electrode array placement in S1 of two owl monkey cases. A, A schematic of the owl monkey brain is shown with area 3b highlighted, as neurons in areas 3a and 1 tend not to respond well to light tactile stimulation under the anesthetic conditions of these experiments. The orientation of the brain is indicated by the arrows; R, rostral and M, medial. B–C, Electrode locations in each owl monkey case were approximated based on examination of myelin-stained sections of flattened cortex and the results of receptive field mapping during recording experiments to estimate the digit and palm pad representations. The placements of the 100-electrode array in each case tended to cover a large part of the area 3b hand representation. The 1 mm scale bar refers to the array size for both monkey cases. D, Digit; PH, hypothenar palm pad; Pi, insular palm pad.
Figure 3.
Figure 3.
Example histograms from a single unit depict peak firing rate and latency changes in response to bimanual stimulation on mirror locations. Histograms are shown for one neuron's responses (unit 074a from case A) when the locations on each hand were stimulated individually, then for both locations simultaneously, and finally for stimulus blocks in which the ipsilateral (left hand) stimulus was presented at intervals before the onset of the contralateral (right hand) stimulus. (Six out of eight stimulation conditions recorded are shown.) Stimulation was presented in blocks of 100 trials. Histograms were smoothed by a spike density function. Vertical dashed lines indicate when the latency was determined in Matlab using the criteria described in the Materials and Methods. The duration for each stimulus was 500 ms, as indicated by the line on the x-axis; therefore, paired stimulation overlapped in time for all stimulus onset delays tested except for 500 ms. The measures we examined in the present study were only the peak firing rate within 50 ms of the contralateral stimulus onset and the associated latency of that response. The peak firing rates were suppressed by bimanual stimulation in this example. Contralateral stimulation alone resulted in a peak firing rate (with baseline activity subtracted) of 27 spikes/s, while the firing rate response dropped to its lowest level of 8 spikes/s when the ipsilateral stimulus preceded the contralateral stimulus by 100 ms.
Figure 4.
Figure 4.
Example histograms from a single unit depict peak firing rate and latency changes in response to bimanual stimulation on nonmirror locations. Stimulation on nonmirror locations resulted in less suppression in the same unit shown in Figure 3 compared with responses during stimulation on mirror locations. In both cases, the firing rate response dropped to its lowest level (14 spikes/s) when the ipsilateral stimulus preceded the contralateral stimulus by 100 ms.
Figure 5.
Figure 5.
Average response magnitudes differ across spatial and temporal stimulus factors. Plots of group averages shown for spatiotemporal stimulus categories. Error bars represent 95% confidence intervals for all panels. Asterisks indicate significant differences relative to the first category in each panel. A, Means of peak firing rate values (spikes/s) are plotted for each temporal stimulation category. Control stimulation on the contralateral location resulted in significant differences from all of the other groups except for the 500 ms stimulus onset delay group. The 100 ms delay group was significantly different from all other groups. The 500 ms delay group was significantly different from all other groups except for 10 ms (and the contralateral control group). All other comparisons not noted were significantly different. B, Means of peak firing rate values are plotted for the two spatial proximity categories: Mirror and Nonmirror. These two groups were not significantly different. C, Means of peak firing rate values are plotted for each type of relationship of the response field to the stimulus locations. Peak firing rates were lower when the stimuli were outside of the response field (OUT_OUT) compared with when the contralateral stimulus was inside the RF (IN_OUT and CN_OUT), and the IN_OUT and CN_OUT groups were not significantly different from each other. D, Means of peak firing rate values are plotted for single units and multiunits, averaged across all stimulus conditions. MUs tended to have higher peak firing rates than SUs.
Figure 6.
Figure 6.
Average response latencies show few differences across spatial and temporal stimulus factors. Conventions follow Figure 5. Error bars represent 95% confidence intervals for all panels. Asterisks indicate significant differences relative to the first category in each panel. A, Mean response latencies (ms) are plotted for each temporal stimulation condition. The control refers to the contralateral stimulus, and numbers refer to the delay between the onset of the ipsilateral stimulus and the onset of the contralateral stimulus (second) from 0 to 500 ms. No pairwise comparisons were significantly different. B, Mean response latencies are plotted for conditions in which the stimulation locations on the two hands were in matched locations on mirror digits (Mirror) and when the stimulation sites were located on different digits of the two hands (Nonmirror). The mean latencies were not significantly different. C, Mean response latencies are plotted for the relationships of the response field of the neurons to the stimulus locations. Latencies were longer when both stimuli were presented outside of the neuron's response field (OUT_OUT) compared with when the contralateral stimulus was inside the response field (IN_OUT and CN_OUT). D, Mean response latencies are plotted for single units and multiunits, averaged across all stimulus conditions. MUs tended to have shorter latencies than SUs.
Figure 7.
Figure 7.
Peak firing rates represented as color maps across the 100-electrode array during bimanual stimulation. Examples of the peak firing activity across the multielectrode array are shown under four experimental conditions in monkey A. Each square represents an electrode in the array and the peak firing rate value of the unit with the highest firing rate averaged over 100 trials during the 50 ms response window. The color scale ranges from 5 to 120 spikes/s, with hot colors representing higher peak firing rates. Electrodes from which no significant responses were obtained during the stimulation are indicated in dark blue (no squares). The dashed lines indicate approximate locations of the representations within area 3b. A, Peak firing rates in case A during a stimulation series on mirror locations on distal digit 2 (dD2) show that no driven activity (> 5 spikes/s) was found when a single site on the ipsilateral digit was stimulated (top left). As expected, activity was evoked when the contralateral distal digit 3 (dD3) was stimulated (top right). When the two nonmirror sites were stimulated simultaneously (lower left), peak firing rates decreased on average across the recording area; however, the effect was not uniform. When the ipsilateral digit was stimulated 100 ms before the onset of the contralateral stimulus, the firing rates were suppressed (lower right). This is one example of the response patterns that were summarized by quantifying the modulation of individual neurons across conditions.
Figure 8.
Figure 8.
Suppression dominates firing rate modulation across spatiotemporal stimulus conditions. A, Comparing the expected sum of the responses to ipsilateral and contralateral stimulation to the actual responses resulted in modulation categories of: “No Difference” compared with the response to the contralateral stimulus alone, “Facilitative” compared with the summation of the responses of the controls, and “Suppressive” compared with the response to the contralateral control. Shaded bars represent the modulation categories. The types of paired stimulation conditions are grouped on the x-axis referring to the stimulus onset delays from 0 to 500 ms, in which the contralateral stimulus was always presented after the ipsilateral stimulus. The row panels show the total counts of these categories for the two spatial stimulus proximity categories, Mirror and Nonmirror. The column panels divide the data based on the response field category: OUT_OUT, IN_OUT, and CN_OUT. As expected, we collected fewer responses to stimulation when both stimulation sites were outside the response field of the neuron, and the counts reflect this, but the trends were the same across the categories. Suppression dominated the modulation types, particularly at longer stimulus onset delays (50–500 ms); whereas many responses were classified as no difference for short stimulus onset delays (0–30 ms). Facilitation occurred rarely, but was predominantly found when the stimulus onset delays were short (0–30 ms). B, The percentage of facilitation and suppression was quantified to provide an index for how much the peak firing rates during paired stimulation differed from expected across the temporal stimulation conditions (x-axis). The values are collapsed across the response field categories, but separate panels show the effects for stimulation on Mirror locations and Nonmirror locations. The plots have dual y-axes such that the mean percentage of suppression in each category is shown by the gray bars and the values follow the left axis. The mean percentage of facilitation is shown by the red line, and data markers and the values follow the right axis. Error bars are 95% confidence intervals. Using this index, when the response to paired stimulation does not differ from the contralateral response, the value is zero. The average percentages for suppression and facilitation include the zero values. The magnitude of facilitation dropped near zero when stimulus onsets were separated by 50–500 ms and hovered around a 10% difference when stimulus onsets were closer in time. The average magnitude of suppression was low when the stimulus onsets were close in time, and increased when the stimulus onsets were separated by longer delays. Responses were suppressed the most on average, by 92%, when mirror locations were stimulated with a 100 ms delay in stimulus onsets.
Figure 9.
Figure 9.
Inter- and intrahemispheric connections in monkeys possibly mediating interhemispheric interactions in area 3b. Schematic diagram of selected somatosensory cortical areas that may mediate interhemispheric interactions in area 3b. Connections indicated are based on neuroanatomical studies and reviews (Killackey et al., 1983; Krubitzer and Kaas, 1990; Kaas, 2000; Wu and Kaas, 2003). The dotted vertical line indicates the midline separating the two cerebral hemispheres. Intrahemispheric connections are shown with thick arrows and interhemispheric connections are shown with thin arrows. The interhemispheric connection between the hand representations of area 3b is sparse (Killackey et al., 1983) and is shown by a dashed line. Otherwise, the schematic is not drawn to represent the scale of areas or the density of connections. However, the schematic illustrates the known pathways through which neurons in area 3b may be influenced by the opposite hemisphere. Note that there are no known direct ipsilateral pathways for information from the hand, thus, subcortical somatosensory areas are not shown.

Similar articles

Cited by

References

    1. Alenda A, Nuñez A. Sensory-interference in rat primary somatosensory cortical neurons. Eur J Neurosci. 2004;19:766–770. - PubMed
    1. Alvarado JC, Vaughan JW, Stanford TR, Stein BE. Multisensory versus unisensory integration: contrasting modes in the superior colliculus. J Neurophysiol. 2007;97:3193–3205. - PubMed
    1. Angelucci A, Levitt JB, Lund JS. Anatomical origins of the classical receptive field and modulatory surround field of single neurons in macaque visual cortical area V1. In: Azmita EC, DeFelipe J, Jones EG, Rakic P, Ribak CE, editors. Progress in brain research, Chap 29. Vol. 136. Elsevier Science B.V; 2002. pp. 373–388. - PubMed
    1. Braun C, Hess H, Burkhardt M, Wühle A, Preissl H. The right hand knows what the left hand is feeling. Exp Brain Res. 2005;162:366–373. - PubMed
    1. Burton H, Fabri M. Ipsilateral intracortical connections of physiologically defined cutaneous representations in area 3b and 1 of macaque monkeys: projections in the vicinity of the central sulcus. J Comp Neurol. 1995;355:508–538. - PubMed

Publication types

LinkOut - more resources