. 2011 Mar 9;31(10):3662-9.
doi: 10.1523/JNEUROSCI.5940-10.2011.

Functional relationships between agonist binding sites and coupling regions of homomeric Cys-loop receptors

Affiliations

Functional relationships between agonist binding sites and coupling regions of homomeric Cys-loop receptors

Natalia Andersen et al. J Neurosci. .

Abstract

Each subunit in a homopentameric Cys-loop receptor contains a specialized coupling region positioned between the agonist binding domain and the ion conductive channel. To determine the contribution of each coupling region to the stability of the open channel, we constructed a receptor subunit (α7-5-HT(3A)) with both a disabled coupling region and a reporter mutation that alters unitary conductance, and coexpressed normal and mutant subunits. The resulting receptors show single-channel current amplitudes that are quantized according to the number of reporter mutations per receptor, allowing correlation of the number of intact coupling regions with mean open time. We find that each coupling region contributes an equal increment to the stability of the open channel. However, by altering the numbers and locations of active coupling regions and binding sites, we find that a coupling region in a subunit flanked by inactive binding sites can still stabilize the open channel. We also determine minimal requirements for channel opening regardless of stability and find that channel opening can occur in a receptor with one active coupling region flanked by functional binding sites or with one active binding site flanked by functional coupling regions. The overall findings show that, whereas the agonist binding sites contribute interdependently and asymmetrically to open-channel stability, the coupling regions contribute independently and symmetrically.


Figures
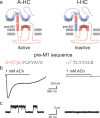
Figure 1.
Figure 1.
Mutations at the coupling region decouple agonist binding from channel gating. a, Schematic diagrams of receptor subunits with the loops located at the coupling region, with each color representing a different segment of the linear sequence; α7 is shown in blue and 5-HT3A in red. The original α7-5-HT3A chimera contains an active coupling region (A-HC). Replacement of the pre-M1 region from 5-HT3A to α7 sequence (I-HC) completely abolishes channel function. b, Macroscopic current responses to 1500 ms pulses of 1 mm ACh obtained in the whole-cell configuration. Holding potential, −50 mV. c, Single-channel recordings in the presence of 1 mm ACh. Membrane potential, −70 mV; filter, 10 kHz. In all single-channel current traces, channel openings are shown as upward deflections. No channel activity is detected for the M1-mutant chimera (I-HC).
Figure 2.
Figure 2.
Coexpression of high- and low-conductance forms of the subunits. Single-channel recordings were obtained in the presence of 1 mm ACh at a membrane potential of −120 mV; filter, 9 kHz. a, Cells were cotransfected with A-HC (left) or A-HC and A-LC (right panel) in a 1:1 subunit ratio. Channel traces are shown at three different timescales. Segments from the 250 ms traces (marked with numbers) are shown below at higher time resolution (50 ms scale). Currents through the HC form of α7-5-HT3A (A-HC) show a single class of current amplitude, whereas discrete amplitude classes are observed from cells transfected with both high- and low-conductance forms (A-HC plus A-LC). b, Cells were cotransfected with A-HC and I-HC (left) or A-HC and I-LC (right panel) in a 1:1 subunit ratio. Channel traces are shown at three different timescales. Segments from the 250 ms traces (marked with numbers) are shown below at higher time resolution (50 ms). Note multiple discrete amplitude classes are detected only in cells transfected with A-HC plus I-LC subunits. Amplitude histograms from whole recordings obtained from cells transfected with A-HC plus I-HC (left) or A-HC plus I-LC (right) are shown at the bottom. Note that, for A-HC plus I-LC, the amplitude classes of 10, 8, 5.8, and 3.8 pA are clearly distinguished. Channels of smaller amplitudes were not analyzed.
Figure 3.
Figure 3.
Activation of receptors with five, four, or three active coupling regions. Cells were cotransfected with A-HC and I-LC subunit cDNAs using different subunit ratios. Channel recordings were performed in the presence of 1 mm ACh at a membrane potential of −120 mV; filter, 9 kHz. Arrangements of subunits giving rise to amplitude classes of 10 pA (5 HC subunits and 5 active coupling regions), 8 pA (4 active coupling regions), and 6 pA (3 active coupling regions) are shown in the left. In the schemes, the black cross indicates inactive coupling region, and high- and low-conductance subunits are shown as black and gray circles, respectively. Open and burst duration histograms were constructed after selecting events corresponding to each amplitude class, plotted on a logarithmic timescale and fitted by the sum of three exponentials.
Figure 4.
Figure 4.
Activation of receptors with two or one active coupling regions. Cells were cotransfected with A-LC and I-HC subunit cDNAs using different subunit ratios. Recordings were obtained in the presence of 1 mm ACh at a membrane potential of −120 mV; filter, 9 kHz. Open and burst duration histograms were constructed after selecting events corresponding to each amplitude class. a, Arrangements of subunits in receptors giving rise to the 6 pA amplitude class containing two active coupling regions (left). Schemes of subunits are as in Figure 3. Channel traces (middle) and open and burst duration histograms fitted by the sum of three exponentials (right) are shown. b, Continuous traces of a single-channel recording from a cell transfected with A-LC/I-HC ratio of 1:9 (1 mm ACh; −120 mV). The amplitude histogram for the corresponding entire recording is shown right. Note the low proportion of channels of the 8 pA amplitude class. c, Arrangements of subunits for receptors giving rise to the amplitude class of 8 pA that contains only one active coupling region (left), channel traces (middle), and corresponding open and burst duration histograms (right).
Figure 5.
Figure 5.
Channel lifetime (●) and burst duration (○) as a function of the number of active coupling regions. Data are from Table 1 and fitted by linear regression. Slopes of the lines are 1.4 ms/subunit (r2 = 0.98) and 2.7 ms/subunit (r2 = 0.93) for open time and burst duration, respectively.
Figure 6.
Figure 6.
Possible subunit arrangements after cotransfection of I-HC with either A-HC-Y190T or A-HC-W55T subunits. Inactive coupling region is shown by the black cross and the binding site mutation by the small filled circle. The arrows indicate functional binding sites.
Figure 7.
Figure 7.
Receptors with different numbers of functional binding sites and coupling regions. a, Cells were cotransfected with A-HC and I-LC-Y190T/W55T subunits. Recordings were obtained in the presence of 2 mm ACh at a membrane potential of −120 mV; filter, 9 kHz. Channel openings of the 8 pA amplitude class, which contain three consecutive binding sites and four active coupling regions as shown in the scheme, were analyzed. Open and burst duration histograms corresponding to this amplitude class are shown right. b, Cells were cotransfected with A-LC and I-HC-Y190T/W55T subunits. Recordings were obtained in the presence of 2 mm ACh at a membrane potential of −120 mV; filter, 9 kHz. Channel openings of the 6 pA amplitude class were analyzed. These channels contain one functional binding site and two active coupling regions in the subunits that form the binding site. Open and burst duration histograms corresponding to this amplitude class were well fitted by two components instead of three.
Figure 8.
Figure 8.
Pentameric arrangements of subunits required for maximal channel lifetime and channel opening. The arrows indicate functional binding sites, and the black crosses indicate inactive coupling regions.

References

    1. Bartos M, Corradi J, Bouzat C. Structural basis of activation of Cys-loop receptors: the extracellular-transmembrane interface as a coupling region. Mol Neurobiol. 2009;40:236–252. - PubMed
    1. Beckstein O, Sansom MS. The influence of geometry, surface character, and flexibility on the permeation of ions and water through biological pores. Phys Biol. 2004;1:42–52. - PubMed
    1. Beckstein O, Sansom MS. A hydrophobic gate in an ion channel: the closed state of the nicotinic acetylcholine receptor. Phys Biol. 2006;3:147–159. - PubMed
    1. Bouzat C, Bren N, Sine SM. Structural basis of the different gating kinetics of fetal and adult acetylcholine receptors. Neuron. 1994;13:1395–1402. - PubMed
    1. Bouzat C, Gumilar F, Esandi MC, Sine SM. Subunit-selective contribution to channel gating of the M4 domain of the nicotinic receptor. Biophys J. 2002;82:1920–1929. - PMC - PubMed

Publication types

MeSH terms

LinkOut - more resources