. 2011 Mar 9;31(10):3670-82.
doi: 10.1523/JNEUROSCI.4750-10.2011.

Experimental protocols alter phototransduction: the implications for retinal processing at visual threshold

Affiliations

Experimental protocols alter phototransduction: the implications for retinal processing at visual threshold

Anthony W Azevedo et al. J Neurosci. .

Abstract

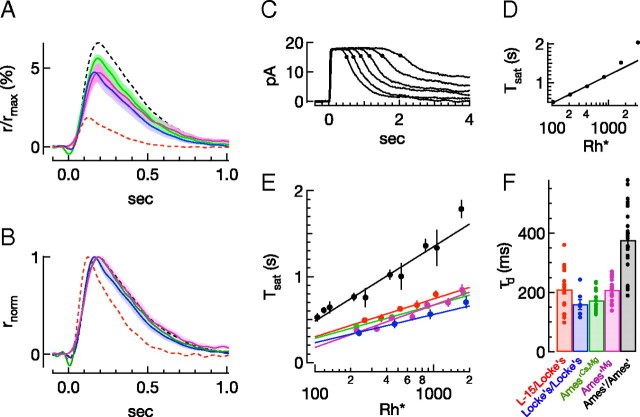
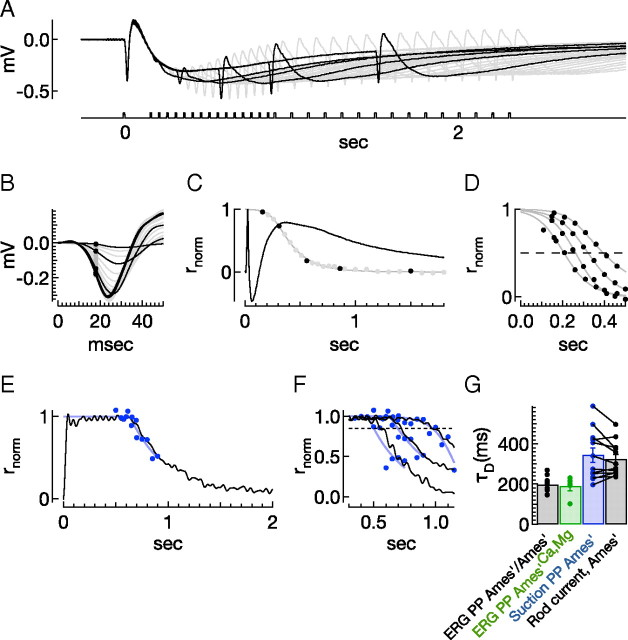
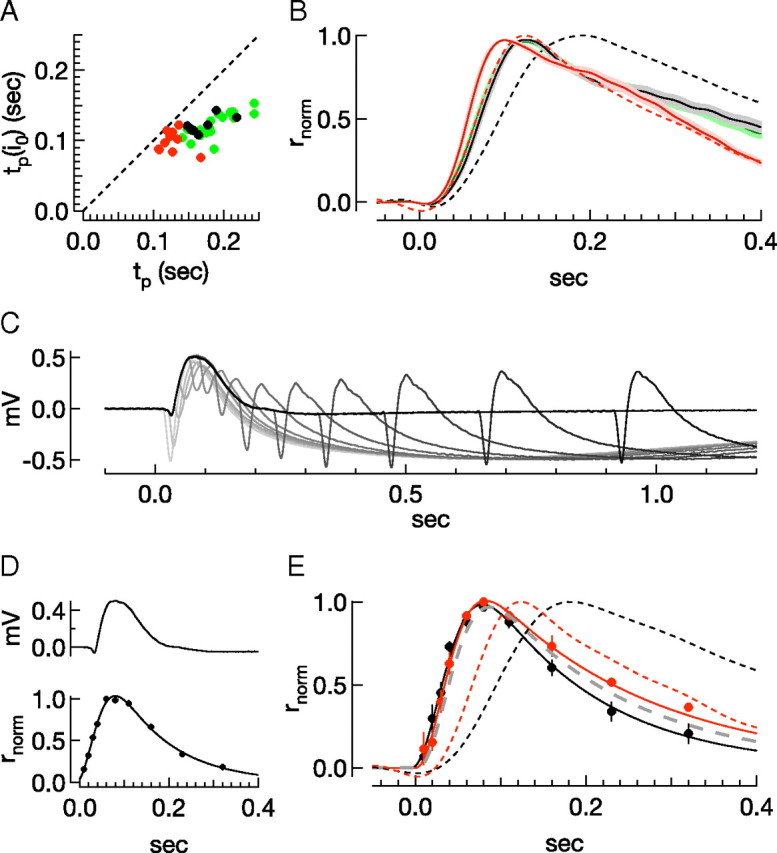
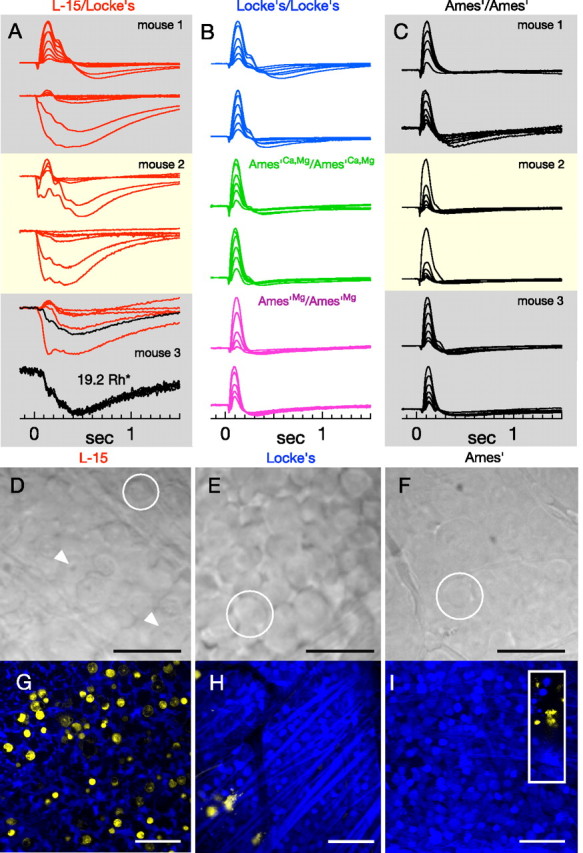
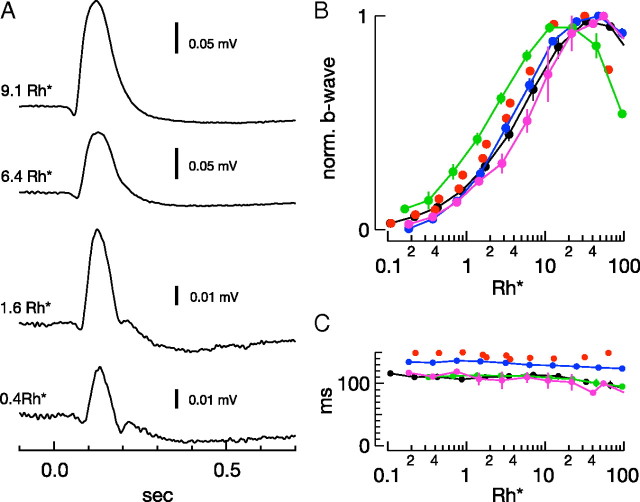
Vision in dim light, when photons are scarce, requires reliable signaling of the arrival of single photons. Rod photoreceptors accomplish this task through the use of a G-protein-coupled transduction cascade that amplifies the activity of single active rhodopsin molecules. This process is one of the best understood signaling cascades in biology, yet quantitative measurements of the amplitude and kinetics of the rod's response in mice vary by a factor of ∼ 2 across studies. What accounts for these discrepancies? We used several experimental approaches to reconcile differences in published properties of rod responses. First, we used suction electrode recordings from single rods to compare measurements across a range of recording conditions. Second, we compared measurements of single-cell photocurrents to estimates of rod function from in vitro electroretinograms. Third, we assayed the health of the post-receptor retinal tissue in these different conditions. Several salient points emerge from these experiments: (1) recorded responses can be altered dramatically by how the retina is stored; (2) the kinetics of the recovery of responses to bright but not dim flashes are strongly sensitive to the extracellular concentration of magnesium; (3) experimental conditions that produce very different single-photon responses measured in single rods produce near identical derived rod responses from the electroretinogram. The dependence of rod responses on experimental conditions will be a key consideration in efforts to extract general principles of G-protein signaling from studies of phototransduction and to relate these signals to downstream mechanisms that facilitate visual sensitivity.


Figures

Figure 1.
Figure 1.
ERG methods and description of paired-pulse derivation of rod responses. A, ERG recording apparatus; scale is approximate. The space between top and bottom where the retina was placed measured ∼12 mm in diameter and 300 μm high. B, Schematic cross-section of retina and measurement of the ERG. OS, Photoreceptor outer segments; ONL, outer nuclear layer; OPL, outer plexiform layer; INL, inner nuclear layer; IPL, inner plexiform layer; GCL, ganglion cell layer. C, Twenty raw ERGs (gray) and average (black) following a 0.2 ms flash producing 40 Rh*/rod in Ames'/Ames' conditions. Reduction in current flowing along the photoreceptor outer segments in response to light results in the corneal-negative deflection of the ERG, termed the a-wave, while the b-wave reflects responses of second-order neurons. D, E, Paired-pulse analysis to derive rod responses in Ames'/Ames', with 4 mm aspartate, which eliminates the b-wave (see Materials and Methods). D, Overlaid responses (gray traces) to paired test (840 Rh*/rod) and probe flashes (1680 Rh*/rod) presented at increasing intervals; the response to the test flash alone is shown in black. E, The probe response rising phases from D (short traces, baseline corrected) are compared with the response to the probe flash alone (complete trace). Comparison is made at the time point of fastest rate of change of the response to the probe alone (dot, black dashed line). The ratio of the rising phase amplitude, at this point, to the amplitude of the probe-alone response (dashed black line) maps out a derived rod response. The recovery points are then fit with a model recovery function (F′(t) = {1 + exp[a(tt1/2)]}−h, t1/2 = 405 ms, a = 14.4, h = 0.3). For illustration purposes in this panel, the black trace plots the function, p [1F′(t)], where p = −45 μV is the amplitude of the response to the probe alone (dashed black line).
Figure 2.
Figure 2.
Rod sensitivity depends on the experimental protocol. A, B, Family of flash responses from a rod in L-15/Locke's (A) and in Ames'/Ames' (B) conditions. Flash strengths double over ranges of 17–524 (A) and 2–516 (B) photons · μm−2. C, The peak fractional current suppression (r/rmax) as a function of the flash strength (mean ± SEM, n = 19 for Ames'/Ames' and 15 for L-15/Locke's). Smooth curves are the saturating exponentials that best fit the population data, with I0 = 57 photons · μm−2 for L-15/Locke's (red), and 28 photons · μm−2 for Ames'/Ames' (black).
Figure 3.
Figure 3.
The rod collecting area does not depend on the experimental protocol. A–F, Frequency of seeing analysis for GCAP−/− rods. A, Raw current trace from GCAP−/− rod in L-15/Locke's, showing responses to three repeated flash strengths (0.7, 1.4, or 2.8 photons · μm−2, stimulus trace below, 30°C). B, Superimposed responses to a flash with strength of 1.4 photons · μm−2, p0 = 0.54. C, The average probability of observing a response (1 − p0), as a function of flash strength, for populations of GCAP−/− rods in both L-15/Locke's (red, n = 5) and Ames'/Ames' (black, n = 8). Smooth lines show the Poisson prediction, 1 − p0(I) = 1−e−mI, with m = 0.50 μm2 in L-15/Locke's and 0.47 μm2 in Ames'/Ames'. D, Raw current trace for Ames'/Ames' condition (flash strengths: 0.6, 1.2, or 2.4 photons · μm−2). E, Superimposed responses to a flash with strength of 1.2 photons · μm−2, p0 = 0.64. F, Collecting areas (CA) from individual GCAP−/− rods in L-15/Locke's (red, 0.50 ± 0.04 μm2), and Ames'/Ames' (black, 0.47 ± 0.02 μm2). G–I, Comparison of variance and frequency of seeing estimates. G, Top, Variance (thin trace) and scaled mean-squared response (thick trace) in a representative rod in Ames'/Ames' (see Materials and Methods) for flash strengths of 1.18, 2.36, and 4.72 photons · μm−2. Scale bars are 0.5 s and 1 pA2. The reciprocal of the scale factor applied to the mean-squared response gives the mean number of effective photon absorptions, n. Bottom, The collecting area, m, is the slope of the best fit line (dotted line) through the n vs I data, in this case, 0.48 μm2. H, Population data in Ames'/Ames' for the integral of the estimated single-photon response using the variance-to-mean-squared method, QV (y-axis, pC) and using a fixed collecting area of 0.5 μm2, QF (x-axis, pC). Filled circles give the average across the population ± SEM. I, Same as H for L-15/Locke's.
Figure 4.
Figure 4.
The single-photon response depends on the experimental protocol. A, Average single-photon responses as a percentage of suppressible current for rods in L-15/Lockes (red, n = 15) and Ames'/Ames' (black, n = 20). Contours are the SEM across a population of rods. B, Normalized responses from A.
Figure 5.
Figure 5.
Dependence of single-photon response and dominant time constant of recovery on divalent concentration. A, Average single-photon responses in different conditions (±SEM), using a fixed collecting area: Locke's/Locke's (blue), Ames'Ca,Mg/Ames'Ca,Mg (green), and Ames'Mg/Ames'Mg (magenta). The Ames' conditions match either Mg2+ alone or both Ca2+ and Mg2+ concentrations in Locke's. B, Normalized single-photon responses in the same conditions and colors. Dashed lines in A and B show single-photon responses from Figure 4: L-15/Locke's (red), Ames'/Ames' (black). C–F, Estimate of the dominant time constant for recovery of light-activated PDE activity. C, D, Illustration of the technique. For a family of responses to bright flashes (Ames'/Ames'; 105, 208, 415, 829, 1658, 3315 Rh*), the time at which a response recovers 15% of the dark current (C) is plotted against the logarithm of the flash strength (D). The slope of this linear relationship estimates the dominant time constant of recovery, in this case, 312 ms. E, Average (log(i), Tsat) pairs for all cells in a given condition; only points below 1000 Rh* are fit. Slopes of best fit lines are as follows: L-15/Locke's, 192 ms; Locke's/Locke's, 143 ms; Ames'Ca,Mg/Ames'Ca,Mg, 168 ms; Ames'Mg/Ames'Mg, 214 ms; Ames'/Ames', 371 ms. F, Summary of dominant time constants from fits to data from individual rods as in D (see also Table 1).
Figure 6.
Figure 6.
Dominant time constants of ERG-derived rod responses show little dependence on divalent concentration. A, ERGs in response to increasing delays between a test (834 Rh*) and probe (834 Rh*) flash (stimulus trace below). Black responses are followed through the subsequent panels. B, Rising phases of the responses to the probe flash, aligned to the time of the flash, when presented alone (thick black trace), and when following a test flash. Dots represent points of comparison to the thick curve, at the point of fastest change (18 ms). This comparison measures the fraction of the remaining rod response, R(ti). C, Fractional response suppression, F(ti) = 1 − R(ti), as a function of the delay between test and probe flashes; the smooth gray curve is the best fit recovery function (see Materials and Methods) (t1/2 = 210 ms, a = 30.6, h = 0.1). The thin black trace is the ERG in response to the test flash alone. D, Four derived rod responses (298, 417, 596, and 834 Rh*). The dashed line plots the 50% criterion level used to determine the dominant time constant. E, Paired-pulse analysis in single rod outer segments (664 Rh*) (F, 332, 664, 1327 Rh*). G, Comparison of dominant time constants for ERG-derived responses in Ames'/Ames' (n = 9) and Ames'Ca,Mg/Ames'Ca,Mg (n = 5) conditions and single-rod recordings using paired-pulse analysis or directly from the current response (as in Fig. 5). Lines for single-cell recordings connect measures from the same cell.
Figure 7.
Figure 7.
Single-rod and ERG-derived responses to half-saturating flashes exhibit similar kinetics across conditions. A, The time-to-peak of the half-saturating response (y-axis) for single-rod recordings plotted against time-to-peak of the single-photon response (x-axis). B, Population mean normalized half-saturating outer segment current responses in L-15/Locke's, Ames'Ca,Mg/Ames'Ca,Mg, and Ames'/Ames', and the normalized single-photon response in L-15/Locke's and Ames'/Ames' (red and black dashed lines; see Fig. 4). C, ERGs in response to increasing delays between test (27 Rh*) and probe (2400 Rh*) flashes. D, Isolated ERG response to a flash producing 27 Rh* in Ames' and the normalized derived rod response using the paired-pulse technique to the same test flash strength. Smooth curve fit to the data is r(t) = γ[(1−exp(−α(ttd)2)]exp(−1/τ), td = −7.8 ms, γ = 2.4, α = 2.3 10−4 ms2, τω = 121 ms. E, Average derived rod responses in Ames'/Ames' (black, td = −4.1 ms, γ = 1.7, α = 3.0 10−4 ms2, τω = 134 ms) and L-15/Locke's (red, td = 0.56 ms, γ = 1.7, α = 3.8 10−4 ms2, τω = 191 ms). The gray dashed line is the same model using the in vivo ERG-derived parameters (Hetling and Pepperberg, 1999) (td = 3.1 ms, γ = 1.84, α = 3.23 10−4 ms2, τω = 163 ms). The dashed lines plot the normalized single-photon response in L-15/Locke's and Ames'/Ames' (red and black dashed lines; see Fig. 4).
Figure 8.
Figure 8.
The viability of retinal tissue under different conditions: in vitro ERGs, morphology, and Live/Dead staining. A–C, Normalized ERGs in response to flash families from individual isolated retinas (∼0.5–40 Rh*/rod). ERGs measured from half of one retina placed in L-15/Locke's conditions (A) (both halves in one box) were followed by ERG recordings from the other retina in Ames'/Ames' (C) (labels identify retina from the same mouse). Each trace is the average of ∼5 responses. The bottom panel depicts individual responses comprising the trace in black in the above flash family (19.2 Rh*). B, Representative ERG families from tissue in Locke's/Locke's (blue), Ames'Ca,Mg/Ames'Ca,Mg (green), and Ames'Mg/Ames'Mg (magenta). ERGs of retina in L-15/Locke's exhibit greater variability than other conditions. D–F, Differential interference contrast images of flat-mounted retinal tissue following storage in cold L-15 (D), warm (32°C) Locke's medium (E), and warm (32°C) Ames medium (F). Scale bars, 25 μm. Circles indicate ganglion cell somas and arrows in D illustrate prominent, pockmarked nuclei. G–I, Confocal images through the ganglion cell layer of live (blue) and dead (yellow) tissue following storage in cold L-15 (G), warm Locke's (H), or Ames' (I) (inset, yellow stained cells at the edge of the retina piece). Scale bars, 50 μm. Counts of yellow nuclei (mean ± SEM) in images of retina stored in cold L-15, 119 ± 32 (n = 8); warm Locke's, 5 ± 1.7 (n = 4); Ames' with elevated Mg2+, 2 (n = 2); Ames', 2.6 ± 0.9 (n = 5). An image of healthy retina on this scale contained 286 ± 16 ganglion cells.
Figure 9.
Figure 9.
Properties of the in vitro scotopic ERG. A, Example Ames'/Ames' ERG traces at various flash strengths. B, Sensitivity of the b-wave amplitude across conditions for samples shown in Figure 8. Average half-saturating strengths in Rh*/rod: Locke's/Locke's (blue), 3.2 Rh*/rod; Ames'/Ames' (black), 4.0 Rh*/rod; Ames'Ca,Mg/Ames'Ca,Mg (green), 1.8 Rh*/rod; Ames'Mg/Ames'Mg (magenta), 5.7 Rh*/rod. Red dots in B and C represent the b-wave amplitudes of the one sample recorded in L-15/Locke's that exhibited a b-wave (Fig. 8H, top family). Half-saturating flash strength for this sample was 2.8 Rh*/rod. C, Average time-to-peak of the b-wave across conditions and flash strength for samples shown in Figure 8.

References

    1. Aho AC, Donner K, Hydén C, Larsen LO, Reuter T. Low retinal noise in animals with low body temperature allows high visual sensitivity. Nature. 1988;334:348–350. - PubMed
    1. Ames A, 3rd, Nesbett FB. In vitro retina as an experimental model of the central nervous system. J Neurochem. 1981;37:867–877. - PubMed
    1. Armstrong-Gold CE, Rieke F. Bandpass filtering at the rod to second-order cell synapse in salamander (Ambystoma tigrinum) retina. J Neurosci. 2003;23:3796–3806. - PMC - PubMed
    1. Baylor DA, Hodgkin AL. Detection and resolution of visual stimuli by turtle photoreceptors. J Physiol. 1973;234:163–198. - PMC - PubMed
    1. Baylor DA, Nunn BJ. Electrical properties of the light-sensitive conductance of rods of the salamander Ambystoma tigrinum. J Physiol. 1986;371:115–145. - PMC - PubMed

Publication types

LinkOut - more resources