. 2011 Mar 9;3(73):73ra19.
doi: 10.1126/scitranslmed.3001180.

Neutrophils activate plasmacytoid dendritic cells by releasing self-DNA-peptide complexes in systemic lupus erythematosus

Affiliations

Neutrophils activate plasmacytoid dendritic cells by releasing self-DNA-peptide complexes in systemic lupus erythematosus

Roberto Lande et al. Sci Transl Med. .

Abstract

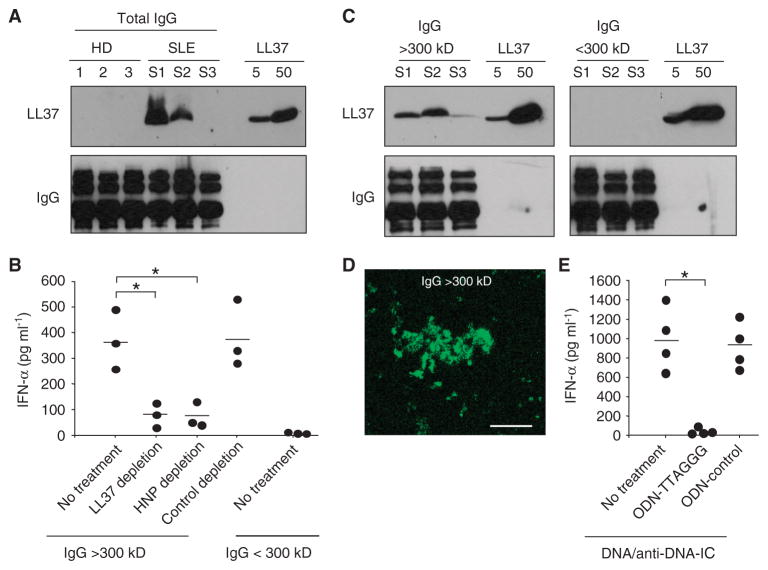
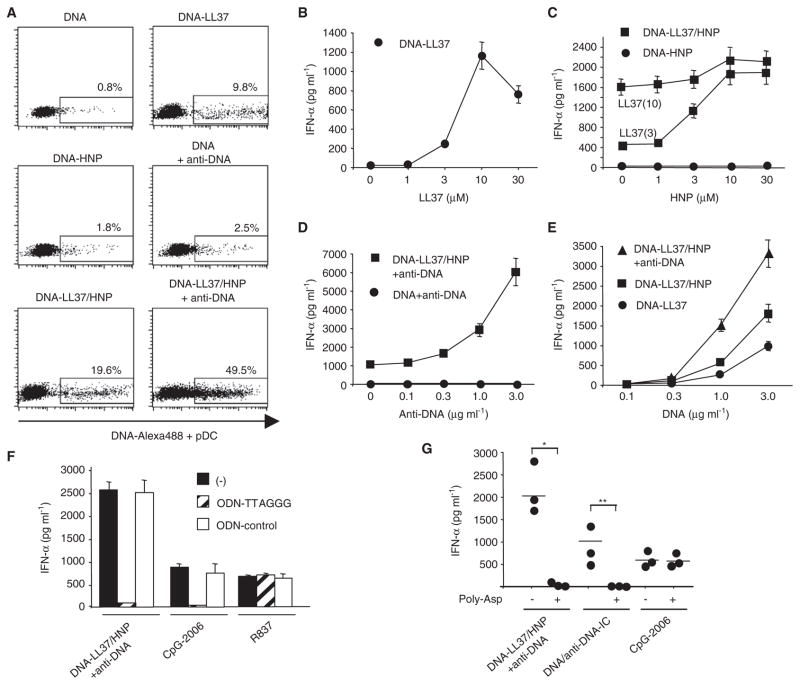
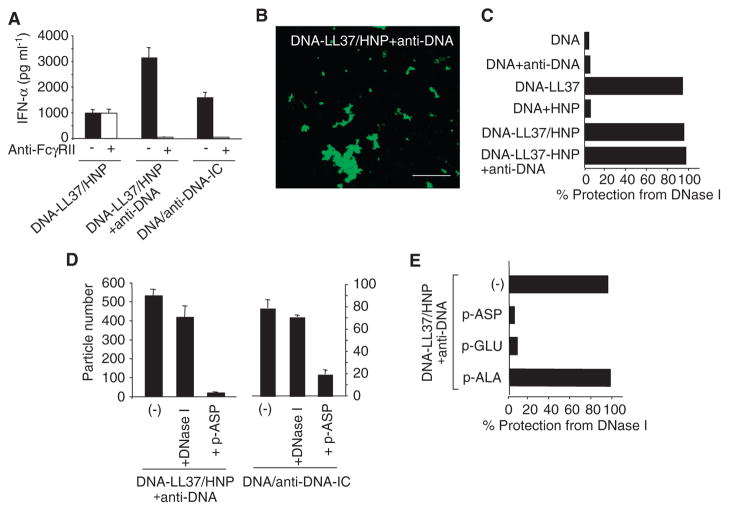
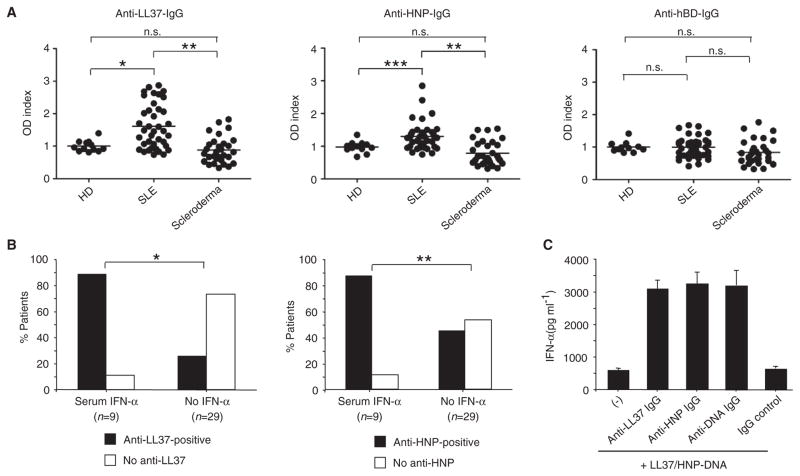
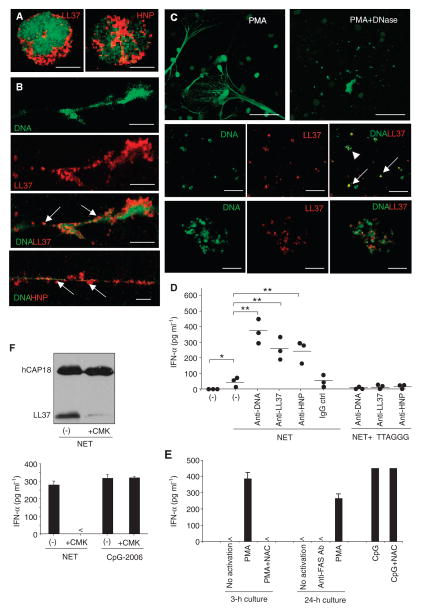
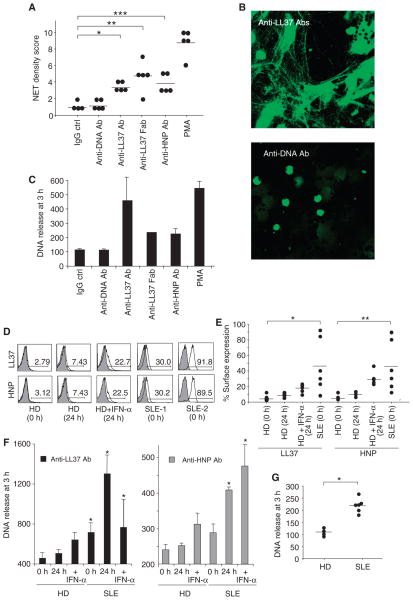
Systemic lupus erythematosus (SLE) is a severe and incurable autoimmune disease characterized by chronic activation of plasmacytoid dendritic cells (pDCs) and production of autoantibodies against nuclear self-antigens by hyperreactive B cells. Neutrophils are also implicated in disease pathogenesis; however, the mechanisms involved are unknown. Here, we identified in the sera of SLE patients immunogenic complexes composed of neutrophil-derived antimicrobial peptides and self-DNA. These complexes were produced by activated neutrophils in the form of web-like structures known as neutrophil extracellular traps (NETs) and efficiently triggered innate pDC activation via Toll-like receptor 9 (TLR9). SLE patients were found to develop autoantibodies to both the self-DNA and antimicrobial peptides in NETs, indicating that these complexes could also serve as autoantigens to trigger B cell activation. Circulating neutrophils from SLE patients released more NETs than those from healthy donors; this was further stimulated by the antimicrobial autoantibodies, suggesting a mechanism for the chronic release of immunogenic complexes in SLE. Our data establish a link between neutrophils, pDC activation, and autoimmunity in SLE, providing new potential targets for the treatment of this devastating disease.


Conflict of interest statement

Competing interests: R.L. and M.G. hold a patent, “Inhibitors of LL-37 mediated immune reactivity to self nucleic acids” (WO/2008/076981, application # PCT/US2007/087787), related to this work.

Figures

Fig. 1
Fig. 1
DNA immune complexes from SLE patients contain neutrophil antimicrobial peptides. (A) Immunoblot detection of LL37 and IgG in total IgG antibodies purified from sera from healthy donors (HD) 1 to 3 or systemic lupus erythematosus (SLE) patients with high anti-DNA antibody titers (S1 to S3). Five and 50 ng of LL37 peptide were used as a positive control. (B) IFN-α produced by pDCs after stimulation with either immune complexes (>300 kD) or monomeric Ig (<300 kD) isolated from total IgGs of SLE patients S1 to S3. In some experiments, immune complexes containing LL37 or HNP were depleted. Each symbol represents an independent experiment, and horizontal bars represent the mean. *P < 0.01, analysis of variance (ANOVA) (adjusted for Dunnett’s test). (C) Immunoblot detection of LL37 and IgG in immune complexes (>300 kD) and monomeric Ig (<300 kD) isolated from IgGs of SLE patients S1 to S3. The LL37 peptide is used as a control. (D) Representative immunofluorescence microscopy image of SLE immune complexes (>300 kD) detected as insoluble particles that stained with DAPI. Bar, 10 μm. (E) IFN-α produced by pDCs after overnight stimulation with purified DNA/anti-DNA immune complexes (IC) after pretreatment of pDC with either a TLR9 inhibitor (ODN-TTAGGG) or a control oligonucleotide (ODN-control). Each symbol represents an independent experiment, and horizontal bars represent the mean. *P < 0.001, Student’s t test.
Fig. 2
Fig. 2
Neutrophil antimicrobial peptides enable the self-DNA in immune complexes to trigger pDC activation. (A) Flow cytometry of pDCs stimulated with human DNAAlexa488 alone or human DNAAlexa488 in complex with LL37, HNP, and anti-DNA antibodies. Fluorescent cells (depicted on the x axis) represent pDCs that have taken up the DNA. (B to E) IFN-α produced by pDCs stimulated with DNA plus increasing concentrations of LL37 (B); DNA plus increasing concentrations of HNP alone or in the presence of LL37 (3 or 10 μM) (C); DNA plus increasing concentrations of anti-DNA antibodies alone or in the presence of LL37 and HNPs (D); and increasing concentrations of DNA in the presence of LL37, LL37 plus HNP, or LL37/HNP plus anti-DNA antibodies (E). (F) IFN-α production by pDC stimulated with DNA-LL37/HNP–anti-DNA complexes after pretreatment with TLR9 inhibitor ODN-TTAGGG or ODN-control. TLR9 agonist CpG-2006 and TLR7 agonist R837 were used as controls. Data in (A) to (F) are representative of at least five independent experiments. Error bars in (B) to (F) represent the SD of triplicate wells. (G) IFN-α production in pDCs stimulated with DNA-LL37/HNP–anti-DNA complexes, natural DNA–anti-DNA immune complexes, or CpG-2006 after pretreatment with polyaspartic acid (Poly-ASP). Each symbol represents an independent experiment, and horizontal bars represent the mean. *P = 0.002; **P = 0.034, ANOVA (Bonferroni adjustment).
Fig. 3
Fig. 3
Neutrophil antimicrobial peptides protect DNA in immune complexes from extracellular degradation. (A) IFN-α produced by pDCs after stimulation with DNA-LL37/HNP complexes, DNA-LL37/HNP–anti-DNA complexes, or DNA–anti-DNA complexes purified from SLE patients with or without neutralization of FcγRII with a blocking antibody. (B) Representative immunofluorescence microscopy image of DNA-LL37/HNP–anti-DNA complexes detected as insoluble particles that stained with DAPI. Bar, 10 μm. (C) Percentage of DNA remaining after treatment of DNA alone or DNA in complex with LL37, LL37/HNP, HNP, anti-DNA, or LL37/HNP + anti-DNA with DNase I for 30 min. Fluorimetric measurement of DNA was done at 480 nm after staining with PicoGreen dye. (D) Number of in vitro–generated DNA-LL37/HNP + anti-DNA complexes and purified DNA/anti-DNA complexes counted as insoluble DAPI+ particles with or without treatment with DNase I or polyaspartic acid (p-ASP). (E) Percentage DNA remaining after treatment of DNA-LL37/HNP + anti-DNA complexes with polyaspartic acid, polyglutamic acid (p-GLU) (both anionic), or polyalanine (p-ALA) (no charge, used as control) followed by 30 min of incubation with DNase I. Data in (A) to (E) are representative of at least five independent experiments. Error bars in (A) represent the SD of triplicate wells, and in (D) the SD of counts by two independent investigators.
Fig. 4
Fig. 4
SLE patients develop autoantibodies against neutrophil antimicrobial peptides. (A) Antibodies to LL37, HNPs, and hBD in sera from patients with SLE (n = 38), scleroderma (n = 30), or healthy controls (HD; n = 12). Results are expressed as optical density (OD) index, which is the ratio of the OD in the patient serum to the mean OD in healthy control sera. Each symbol represents an independent patient, and horizontal bars represent the mean. *P = 0.002; **P < 0.0001; ***P = 0.023, ANOVA (adjusted for Dunnett’s test). n.s., not significant. (B) Percentages of SLE patients with or without significant anti-LL37 antibody titers (cutoff value OD index, 1.611; sensitivity, 41%; specificity, 100%; left panel) or SLE patients with or without anti-HNP antibody titers (cutoff value OD index, 1.15; sensitivity, 59%; specificity, 91%; right panel) among patients with detectable IFN-α (n = 9) and patients without IFN-α in the serum (n = 29). *P = 0.001; **P = 0.05, Fisher’s exact test. (C) IFN-α produced by pDC stimulation with in vitro–generated DNA-LL37/HNP complexes alone or with anti-LL37, anti-HNP, anti-DNA, or IgG control antibodies. One representative of at least three independent experiments is shown. Error bars represent the SD of triplicate wells.
Fig. 5
Fig. 5
NETting neutrophils release self-DNA–antimicrobial peptide complexes that activate pDCs. (A to C) Confocal microscopy of unstimulated neutrophils (A), NETting neutrophils activated for 3 hours with phorbol 12-myristate 13-acetate (PMA) (B), or NETting neutrophils activated with PMA followed by treatment with DNase I (C), stained for DNA (green), LL37 (red), or HNPs (red) as indicated. Representative images are shown. Bars, 5 μm (A), 10 μm (B), 50 μm (C, upper panel), 20 μm (C, middle panel), and 4 μm (C, lower panel). Arrows indicate DNA–antimicrobial peptide complexes contained in NETs before (B) and after (C) DNase treatment. A high-power image of a complex indicated by the arrowhead is provided in the lower panel of (C). (D) IFN-α produced by pDCs stimulated with supernatants of NETting neutrophils alone or in the presence of anti-LL37, anti-HNP, anti-DNA, or control antibodies. In some experiments, the pDCs were pretreated with the TLR9 inhibitor ODN-TTAGGG. Each symbol represents an independent experiment, and horizontal bars represent the mean. *P = 0.023; **P < 0.04, ANOVA (Bonferroni adjustment). (E) Supernatants of neutrophils activated for 3 hours with PMA after pretreatment with N-acetyl-L-cysteine (NAC; 5 mM) to block NET formation, and supernatants of neutrophils stimulated for 24 hours with an anti-FAS antibody (Ab) to induce apoptosis, were used to stimulate pDCs. (F) Supernatants of NETting neutrophils pretreated with the serine protease inhibitor chloromethyl ketone (CMK) were used for immunoblot detection of LL37 and hCAP18 (upper panel) and to stimulate pDC for IFN-α production (lower panel). TLR9 agonist CpG-2006 was used as a positive control to exclude NET-independent effects of CMK on pDC activation. (E to F) One representative of at least three independent experiments is shown. Error bars represent the SD of triplicate wells.
Fig. 6
Fig. 6
Autoantibodies to neutrophil antimicrobial peptides trigger abundant NET release in neutrophils of SLE patients. (A to C) Purified neutrophils from healthy donors were stimulated as indicated. NET-DNA release was quantified after 3 hours either by confocal microscopy (A and B) or by fluorimetry of the supernatants after PicoGreen staining (C). In (A), NET density was quantified in multiple experiments and scored to reflect the image area covered by NET structures. *P = 0.024; **P < 0.001; ***P = 0.006, ANOVA (adjusted for Dunnett’s test). In (B), representative confocal images of anti-LL37– and anti-DNA–stimulated neutrophils stained for DNA. In (C), NET-DNA is given as nanogram of DNA released by 106 neutrophils. Mean ± SD of four independent donors is shown. (D and E) Flow cytometry analysis of LL37 and HNP surface expression on freshly isolated neutrophils (0 h) and neutrophil cultured for 24 hours with or without IFN-α (24 h) from healthy donors in comparison to freshly isolated neutrophils (0 h) from SLE patients. Representative plots are shown in (D); results from multiple independent donors are given in (E). *P = 0.030; **P = 0.025, Student’s t test. (F) Freshly isolated neutrophils (0 h) or cultured for 24 hours with or without IFN-α (24 h) were stimulated for 3 hours with anti-LL37 and anti-HNP antibodies. DNA release was measured by fluorimetry in cell-free supernatants, and data are given as nanogram of DNA released by 106 neutrophils. The mean ± SD of at least four independent donors is shown. *P < 0.05, ANOVA (Bonferroni adjustment). In the absence of stimulation, the levels of DNA released into the supernatant by neutrophils cultured for 24 hours (110 ± 25 for healthy neutrophils, and 240 ± 80 for SLE neutrophils) were similar to the levels released by freshly isolated neutrophils cultured for 3 hours. This indicates that the free DNA detected in the supernatant is actively released by neutrophils activated by anti-LL37 or anti-HNP antibodies and does not represent DNA passively released in the context of neutrophil apoptosis and secondary necrosis induced during the 24-hour culture. (G) Freshly isolated neutrophils (0 h) of healthy donors and SLE patients were cultured for 3 hours without any stimulus. DNA release was measured in the cell-free supernatants by fluorimetry. Each dot represents an independent donor. *P = 0.03, ANOVA (Bonferroni adjustment).

Comment in

References

    1. Rönnblom L, Pascual V. The innate immune system in SLE: Type I interferons and dendritic cells. Lupus. 2008;17:394–399. - PMC - PubMed
    1. Theofilopoulos AN, Baccala R, Beutler B, Kono DH. Type I interferons (α/β) in immunity and autoimmunity. Annu Rev Immunol. 2005;23:307–336. - PubMed
    1. Marshak-Rothstein A. Toll-like receptors in systemic autoimmune disease. Nat Rev Immunol. 2006;6:823–835. - PMC - PubMed
    1. Shlomchik MJ. Activating systemic autoimmunity: B’s, T’s, and tolls. Curr Opin Immunol. 2009;21:626–633. - PMC - PubMed
    1. Blanco P, Palucka AK, Gill M, Pascual V, Banchereau J. Induction of dendritic cell differentiation by IFN-α in systemic lupus erythematosus. Science. 2001;294:1540–1543. - PubMed

Publication types