. 2011 Mar 10;471(7337):177-82.
doi: 10.1038/nature09802.

Network anatomy and in vivo physiology of visual cortical neurons

Affiliations

Network anatomy and in vivo physiology of visual cortical neurons

Davi D Bock et al. Nature. .

Abstract

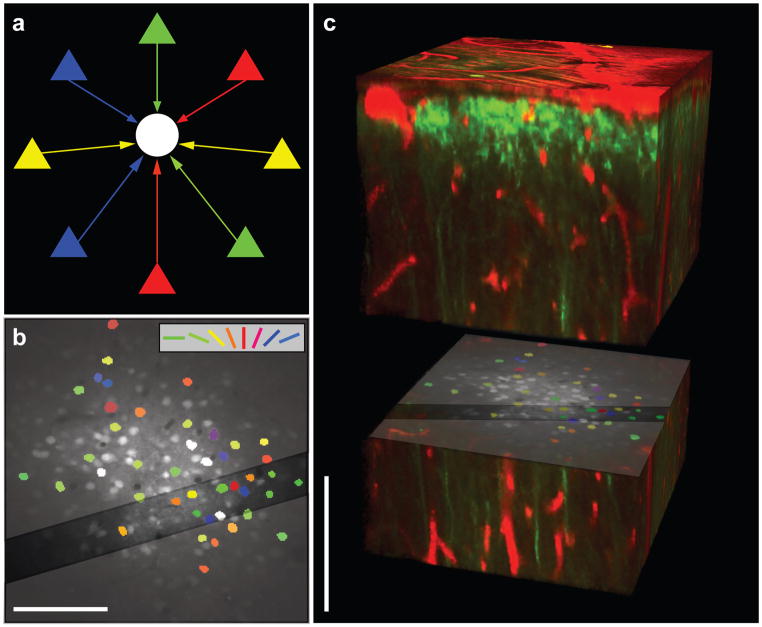
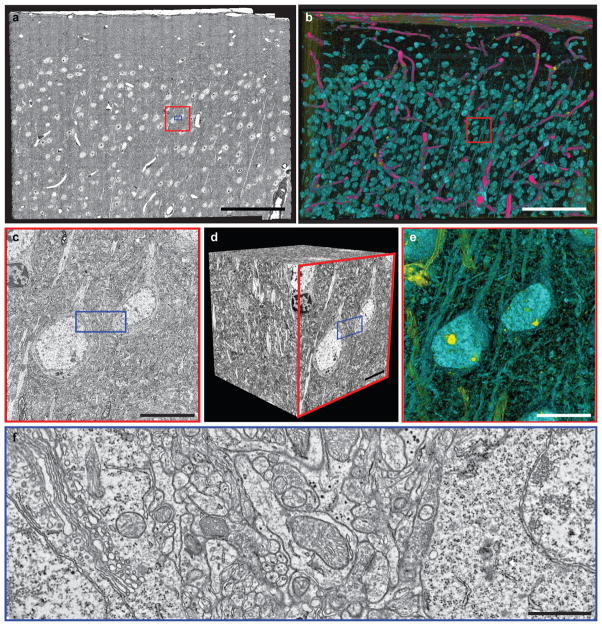
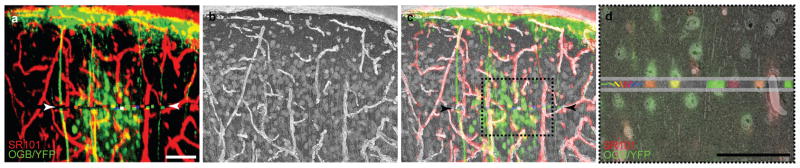
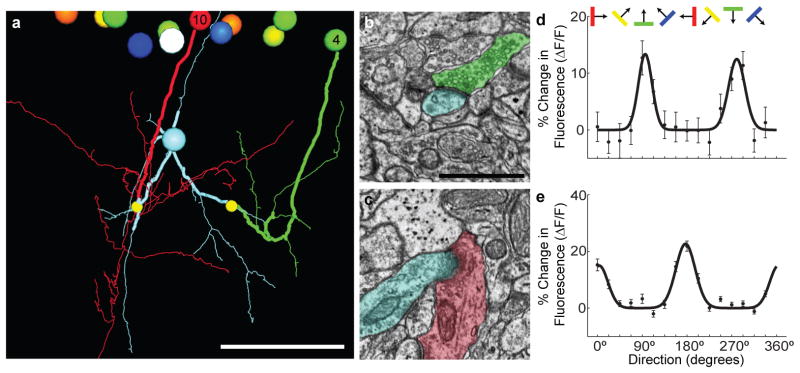
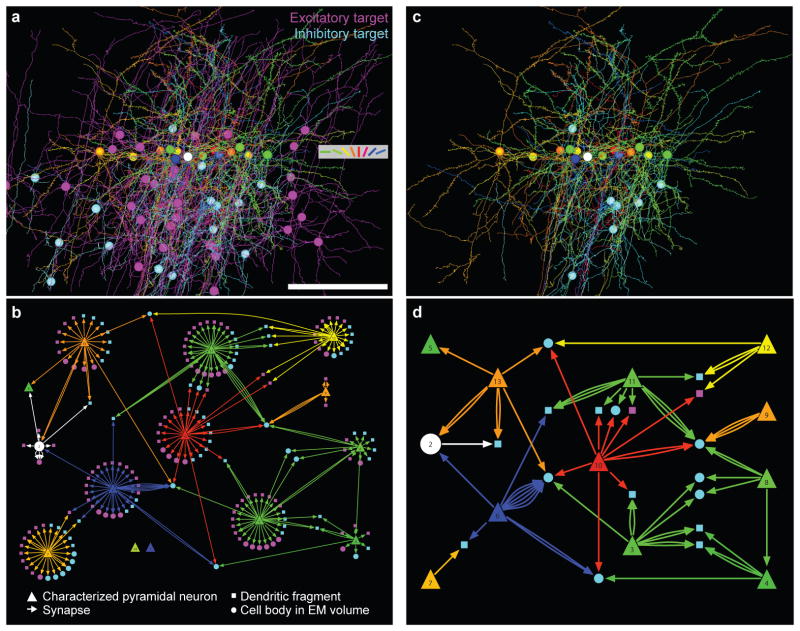
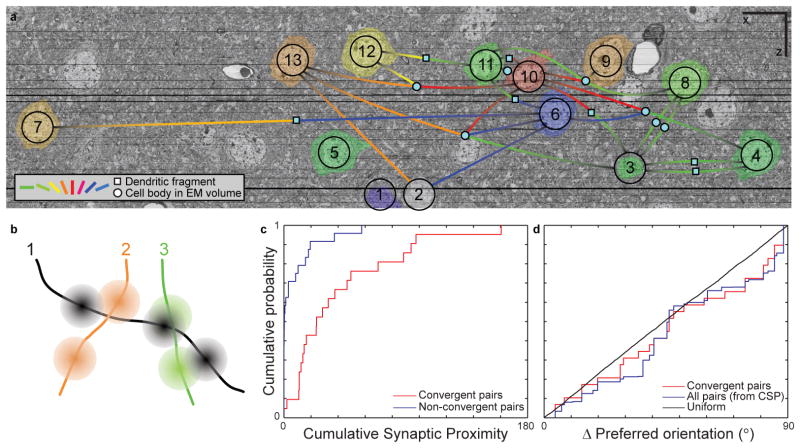
In the cerebral cortex, local circuits consist of tens of thousands of neurons, each of which makes thousands of synaptic connections. Perhaps the biggest impediment to understanding these networks is that we have no wiring diagrams of their interconnections. Even if we had a partial or complete wiring diagram, however, understanding the network would also require information about each neuron's function. Here we show that the relationship between structure and function can be studied in the cortex with a combination of in vivo physiology and network anatomy. We used two-photon calcium imaging to characterize a functional property--the preferred stimulus orientation--of a group of neurons in the mouse primary visual cortex. Large-scale electron microscopy of serial thin sections was then used to trace a portion of these neurons' local network. Consistent with a prediction from recent physiological experiments, inhibitory interneurons received convergent anatomical input from nearby excitatory neurons with a broad range of preferred orientations, although weak biases could not be rejected.


Conflict of interest statement

The authors declare no competing financial interests.

Figures

Figure 1
Figure 1. Functional characterization of neurons before anatomical reconstruction
a, Schematic representation of diverse input to inhibitory interneurons. Excitatory pyramidal cells (triangles) with varied preferred orientations (different colours) provide input (coloured arrows) to an inhibitory interneuron (white circle). b, Cell-based visual orientation preference map in the mouse visual cortex from in vivo two-photon calcium imaging. Visually responsive cells are coloured according to their estimated preferred orientation, with broadly tuned cells (OSI ≤ 0.2) coloured white. Dark diagonal band: region targeted for acquisition of EM sections, cut orthogonal to image plane. c, In vivo two-photon fluorescence image of the 3-D anatomical volume (red: blood vessels or astrocytes, green: OGB or YFP) separated to expose the functionally imaged plane. Scale bars, 100 μm.
Figure 2
Figure 2. Large-scale electron microscopy
a, Electron micrograph of an entire 120,000 x 80,000 pixel thin section, showing the pial surface (top) and cortical layers 1 through upper 4 (bottom). c, f: Zoomed-in view of (c) two functionally characterized cells (red outline in a), and (f) the neuropil between them (blue outlines in a, c, and d), illustrating the density of axons and dendrites coursing between cell bodies. d, A cube of the EM volume with c as one face. b, e: 3–D renderings of the EM volume (b, Supplementary Movie 3) through the entire series and (e) through 50 sections of the cube in d (red outline in b, Supplementary Movie 4). Pink represents electron transparent regions (e.g. blood vessels), yellow represents regions that are electron dense (e.g. nucleoli, oligodendrocyte nuclei, and myelin), and aqua denotes regions with pixel values in between (e.g. nuclei, cell bodies and dendrites). Scale bars, a–b: 100 μm, c–e: 10 μm, f: 1 μm.
Figure 3
Figure 3. Correspondence between in vivo fluorescence anatomy and electron microscopy
a, Maximum-intensity projection of the in vivo fluorescence anatomy corresponding to the EM volume. Red: blood vessels, green: cells. Colors between arrowheads correspond to orientation preference of neurons in the imaged plane, as in d. b, Projection through 37 EM sections evenly spaced in the series. c, Merge of EM and fluorescence projections. d, Zoomed-in view of the region outlined in c, showing the overlay of in vivo and EM data in a single thin section. Horizontal grey lines delineate the functionally imaged plane. Within the functionally imaged plane, the cell bodies of six neurons of known orientation preference (from left to right: cells 13, 12, 11, 10, 9 and 8, coloured as in Fig. 1b) are well registered with their EM ultrastructure. Outside the functionally imaged plane, blood vessels and astrocytes in the EM are well registered with the red SR101 staining. Scale bars, 50 μm.
Figure 4
Figure 4. Convergent synaptic input onto inhibitory interneurons
a, 3-D rendering of axonal contacts onto a postsynaptic neuron. Large balls at the top represent cell bodies of excitatory cells within the functionally imaged plane. Axons of a horizontally tuned neuron (cell 4; green) and a vertically tuned neuron (cell 10; red) descend and make synapses (small yellow balls) onto dendrites of an inhibitory interneuron (cyan). The axonal and dendritic segments leading to the convergence were independently traced by a second person, blind to the original segmentation (thick tracing). Cell bodies and axons coloured by orientation preference, as in Fig. 1b. Scale bar, 50 μm. b–c, Electron micrographs showing the synapses onto the inhibitory neuron from (b) cell 4 and (c) cell 10 with corresponding colours overlaid. Scale bar, 1 μm. d–e, Orientation tuning curves derived from in vivo calcium imaging of the cell bodies of (d) cell 4 and (e) cell 10. Error bars are +/− SEM.
Figure 5
Figure 5. From anatomy to connectivity graphs
a, 3-D rendering of the dendrites, axons, and cell bodies of 14 neurons in the functionally imaged plane (coloured according to their orientation preference, as in Fig. 1b), and the dendrites and cell bodies of all their postsynaptic targets traced in the EM volume (magenta: excitatory targets; cyan: inhibitory targets; spines on postsynaptic targets not shown; Supplementary Movie 5). Scale bar, 100 μm. b, Directed network diagram of the functionally characterized cells and their targets, derived from a. Postsynaptic excitatory (magenta) and inhibitory (cyan) targets with cell bodies contained within the EM volume are drawn as circles. Other postsynaptic targets (dendritic fragments) are drawn as squares. c, 3-D rendering of the arbors and cell bodies of functionally characterized neurons, along with postsynaptic targets that either receive convergent input from multiple functionally characterized neurons, or were themselves functionally characterized (Supplementary Movie 5). d, A subset of the network graph showing only the connections in c, all independently verified.
Figure 6
Figure 6. Convergent synaptic input onto inhibitory interneurons is predicted by proximity, not function
a, A portion of the aligned and registered EM image series re-sliced parallel to the functionally imaged plane, through 1153 EM sections. Overlaid is a network graph of the convergences onto inhibitory interneurons. Visually responsive cell bodies are pseudo-coloured according to their preferred orientation (as in Fig. 1b),and numbered as in Figs. 4–5. Convergences onto inhibitory neuronal targets are represented by lines, corresponding to one or more synapses, leading either to solid cyan circles (targets traced to cell bodies in the EM volume) or squares (dendritic fragments). Cell 14 was partially contained in the EM volume and is not shown. Scale bars, 10 μm. b, Schematic of cumulative synaptic proximity (CSP). Line segments represent axons, with 3–D Gaussians centred at each synapse. A CSP was calculated for each pair of orientation-tuned neurons by summing all pair-wise overlaps of Gaussians from the two axons (σ = ~12 μm, see Methods). c, Pairs of axons whose synaptic boutons were in close proximity were more likely to converge onto a common target. The CSP of axon pairs participating in convergences (red) was significantly greater than for non-converging pairs (blue; p<1.3 x 10⁻⁵, two-sample Kolmogorov-Smirnov test, nconvergent pairs = 21, nnon-convergent pairs = 24). d, Convergences were not predicted by the difference in orientation preference between presynaptic cell pairs. The distribution of differences in orientation preference was not significantly different from a uniform distribution (p > 0.30, two-sample Kolmogorov-Smirnov test, nconvergences = 29) or a model distribution (see Methods) based on CSP (p > 0.68, two-sample Kolmogorov- Smirnov test, nconvergences = 29).

Comment in

References

    1. Ramón y, Cajal S. Textura del Sistema Nervioso del Hombre y de los Vertebrados. Moya; 1904.
    1. Binzegger T, Douglas RJ, Martin KA. A quantitative map of the circuit of cat primary visual cortex. J Neurosci. 2004;24:8441–8453. - PMC - PubMed
    1. Stepanyants A, et al. Local potential connectivity in cat primary visual cortex. Cereb Cortex. 2008;18:13–28. - PubMed
    1. Mason A, Nicoll A, Stratford K. Synaptic transmission between individual pyramidal neurons of the rat visual cortex in vitro. J Neurosci. 1991;11:72–84. - PMC - PubMed
    1. Markram H, Lubke J, Frotscher M, Roth A, Sakmann B. Physiology and anatomy of synaptic connections between thick tufted pyramidal neurones in the developing rat neocortex. J Physiol. 1997;500 (Pt 2):409–440. - PMC - PubMed

Publication types

MeSH terms