. 2011 Feb 15;6(2):e17080.
doi: 10.1371/journal.pone.0017080.

The light responsive transcriptome of the zebrafish: function and regulation

Affiliations

The light responsive transcriptome of the zebrafish: function and regulation

Benjamin D Weger et al. PLoS One. .

Abstract

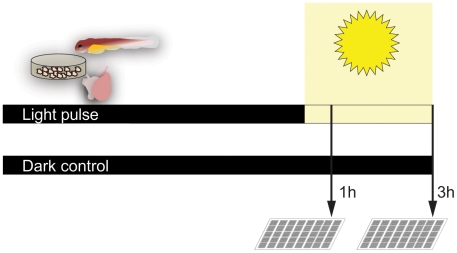
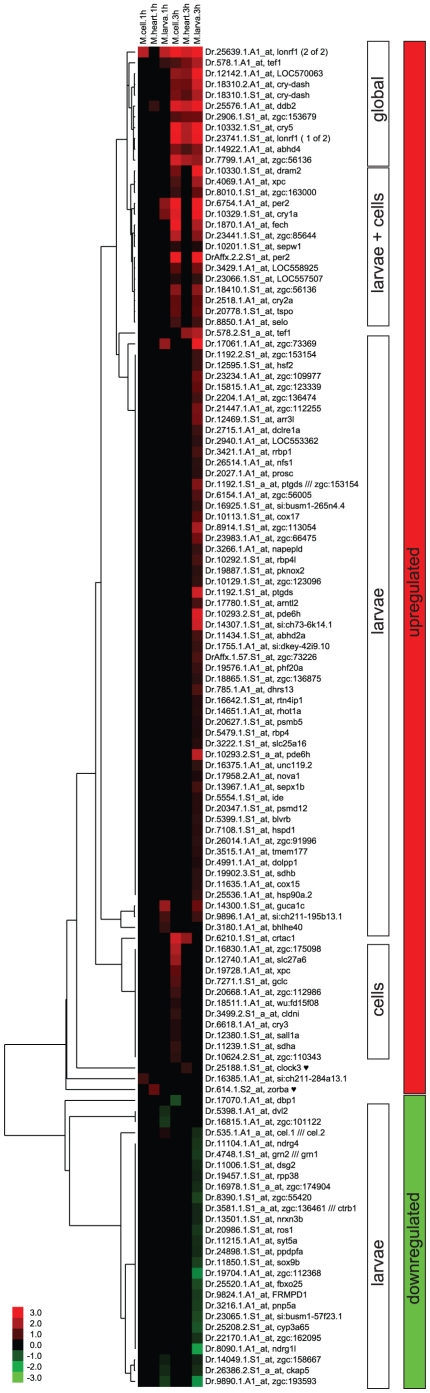
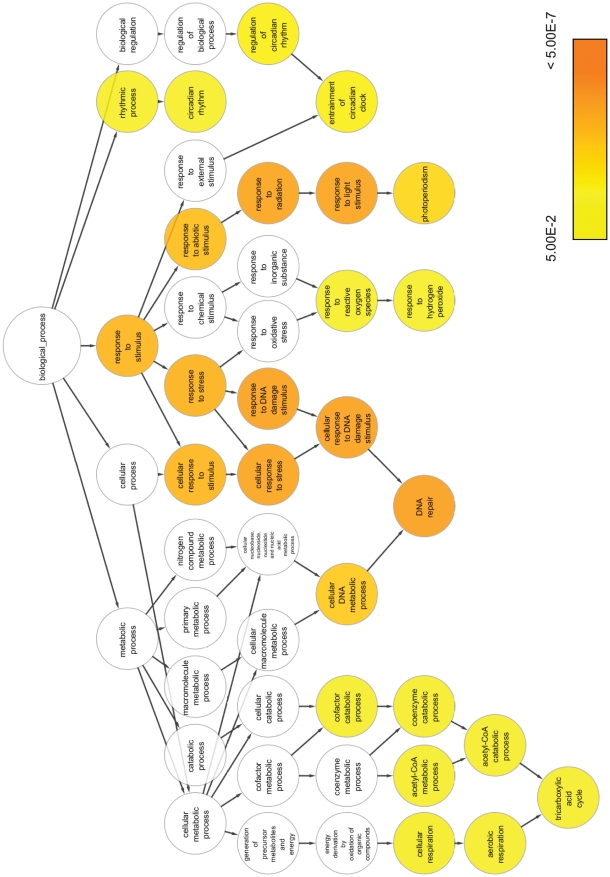
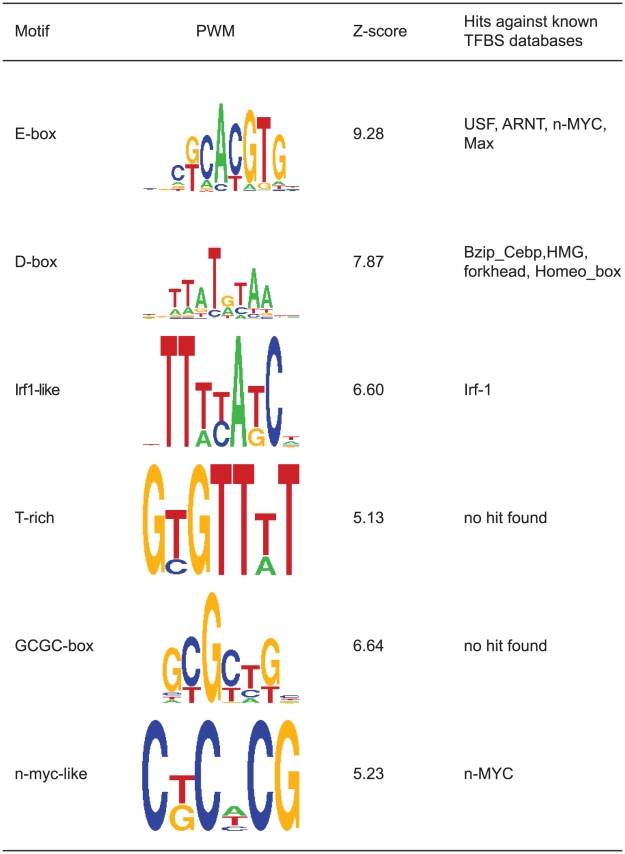
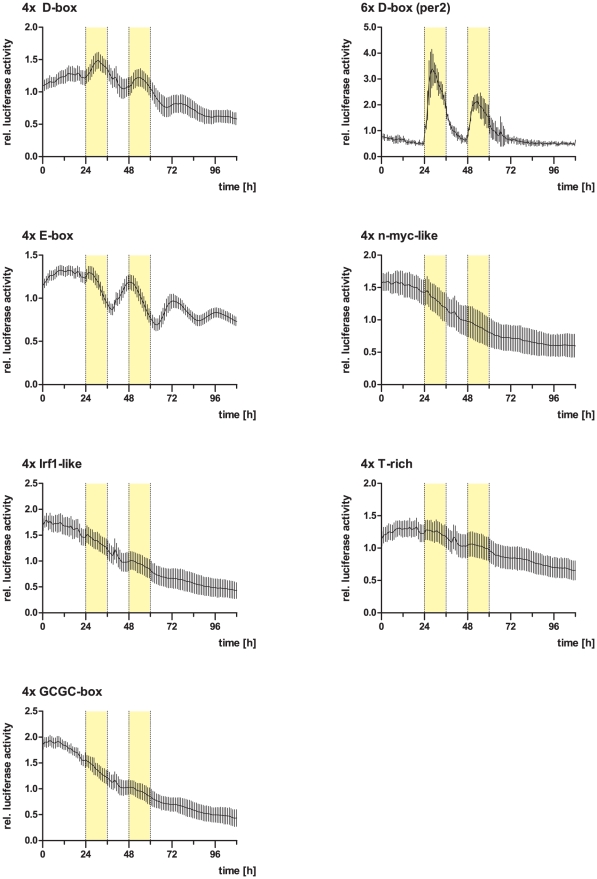
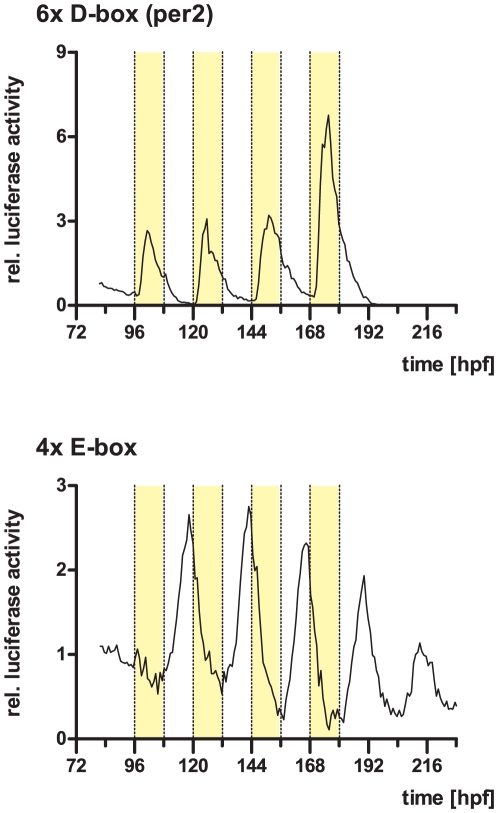
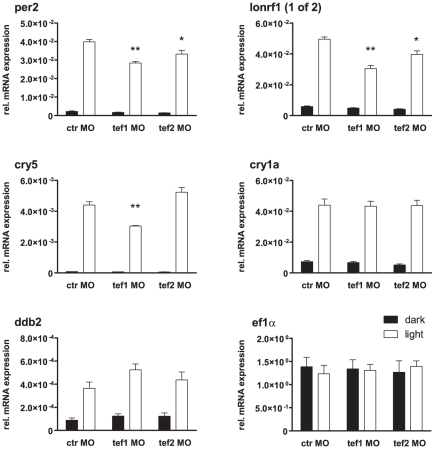
Most organisms possess circadian clocks that are able to anticipate the day/night cycle and are reset or "entrained" by the ambient light. In the zebrafish, many organs and even cultured cell lines are directly light responsive, allowing for direct entrainment of the clock by light. Here, we have characterized light induced gene transcription in the zebrafish at several organizational levels. Larvae, heart organ cultures and cell cultures were exposed to 1- or 3-hour light pulses, and changes in gene expression were compared with controls kept in the dark. We identified 117 light regulated genes, with the majority being induced and some repressed by light. Cluster analysis groups the genes into five major classes that show regulation at all levels of organization or in different subset combinations. The regulated genes cover a variety of functions, and the analysis of gene ontology categories reveals an enrichment of genes involved in circadian rhythms, stress response and DNA repair, consistent with the exposure to visible wavelengths of light priming cells for UV-induced damage repair. Promoter analysis of the induced genes shows an enrichment of various short sequence motifs, including E- and D-box enhancers that have previously been implicated in light regulation of the zebrafish period2 gene. Heterologous reporter constructs with sequences matching these motifs reveal light regulation of D-box elements in both cells and larvae. Morpholino-mediated knock-down studies of two homologues of the D-box binding factor Tef indicate that these are differentially involved in the cell autonomous light induction in a gene-specific manner. These findings suggest that the mechanisms involved in period2 regulation might represent a more general pathway leading to light induced gene expression.


Conflict of interest statement

Competing Interests: The authors have declared that no competing interests exist.

Figures

Figure 1
Figure 1. Experimental design of the study.
We examined light induced gene expression at three levels of organization: The cell (PAC2 cells), the organ (cultured hearts) and the organism (larvae). Samples were kept in the dark to desynchronize their clocks before being exposed to a 1 or 3-hour light pulse or left in the dark as a control. Samples from three biological repeats per treatment and control were hybridized to Affymetrix Zebrafish GeneChips.
Figure 2
Figure 2. Cluster analysis of the microarray experiments.
Results of cluster analysis of the microarray experiments. Upregulated transcripts are shown in red, downregulated ones in green, with the colour intensity indicating the log2 fold change values. Five major clusters can be identified: globally upregulated, up in larvae and cells, up in larvae only, up in cells only and downregulated in the larvae. For details see text. formula image, heart specific genes.
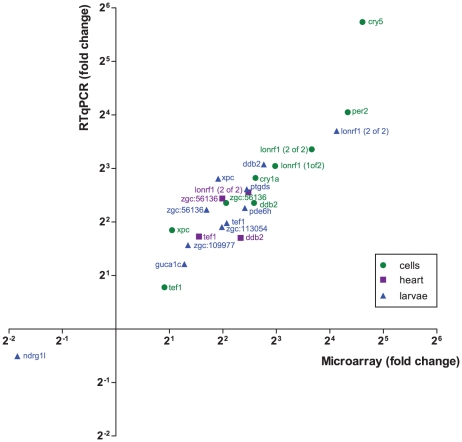
Figure 3
Figure 3. qPCR validation of the microarray results.
Graph indicating the correlation of light induced fold change values as determined by RTqPCR (y-axis) and microarray (x-axis) for 24 gene-treatment combinations. Values are given for genes tested in cells (green circles), hearts (purple squares) and larvae (blue triangles). The correlation is statistically highly significant (Spearman r = 0.9009, p<0.0001).
Figure 4
Figure 4. Gene Ontology hierarchy and enrichment statistics for the biological process ontology.
GO terms within the biological process ontology that are significantly enriched (adjusted p≤0.05) in the light induced gene set are indicated in colour, with the colour shade corresponding to the enrichment p-value.
Figure 5
Figure 5. Enriched sequence motifs as identified by Trawler in the promoters of the light induced gene set.
Table indicating positional weight matrices (PWM), Z scores and hits of the motifs in databases of known transcription factor binding sites (TFBS).
Figure 6
Figure 6. Bioluminescence traces of Pac2 cells containing reporter constructs with concatemerised Trawler motifs.
Graphs show relative luciferase activity for the indicated motifs over several days under the indicated light dark regimes. Yellow bars represent times with lights on. Values are means of 8 independent wells, error bars indicate standard deviation. For details see text.
Figure 7
Figure 7. Bioluminescence traces of single larvae injected with E- and D-box reporter constructs.
Graphs show relative luciferase activity of a representative single zebrafish larva injected with the indicated reporter construct. Yellow bars represent times with lights on. hpf, hours post fertilization. See text for details.
Figure 8
Figure 8. Morpholino mediated knock down of tef1 and tef2 differentially affects the light response in PAC2 cells.
Bar diagrams showing the expression levels as measured by RTqPCR of the indicated genes under dark control (black) and after a 3-hour light pulse (white) for control morpholino (ctr MO), tef1 morpholino (tef1 MO) and tef2 morpholino (tef2 MO) treated cells. Light induced expression of per2 and lonrf (1of2) is attenuated by both tef1 and tef2 knockdown, cry5 is affected only by tef1 knockdown, and ddb2 and cry1a are affected by neither. ef1a serves as control for a non-light responsive gene. Values represent fold β-actin mRNA levels. Statistical significance of expression differences to the light control was determined by an unpaired t test and is indicated as follows: **, p≤0.01; *, p≤0.05.

References

    1. Dunlap J, Loros J, DeCoursey P. Sunderland: Sinauer Associates; 2004. Chronobiology.
    1. Dickmeis T. Glucocorticoids and the circadian clock. J Endocrinol. 2009;200:3–22. - PubMed
    1. Takahashi JS, Hong HK, Ko CH, McDearmon EL. The genetics of mammalian circadian order and disorder: implications for physiology and disease. Nat Rev Genet. 2008;9:764–775. - PMC - PubMed
    1. Vallone D, Lahiri K, Dickmeis T, Foulkes NS. Start the clock! Circadian rhythms and development. Dev Dyn. 2007;236:142–155. - PubMed
    1. Berson DM. Phototransduction in ganglion-cell photoreceptors. Pflugers Arch. 2007;454:849–855. - PubMed

Publication types

MeSH terms