. 2011 Mar 3;6(3):e17515.
doi: 10.1371/journal.pone.0017515.

Murine melanoma-infiltrating dendritic cells are defective in antigen presenting function regardless of the presence of CD4CD25 regulatory T cells

Affiliations

Murine melanoma-infiltrating dendritic cells are defective in antigen presenting function regardless of the presence of CD4CD25 regulatory T cells

Haley Ataera et al. PLoS One. .

Abstract

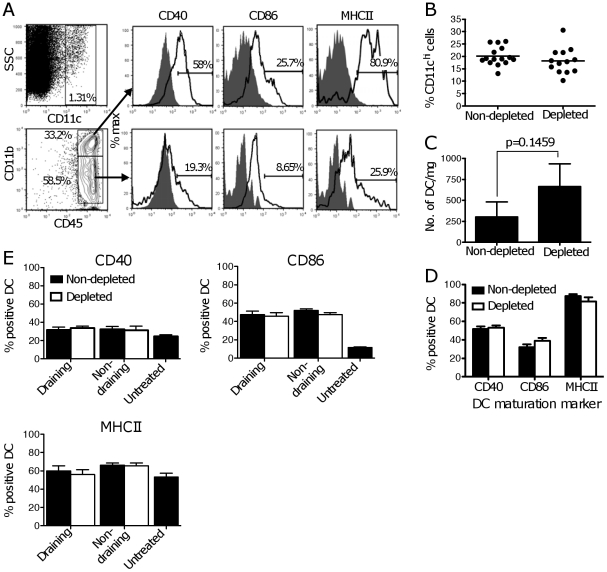
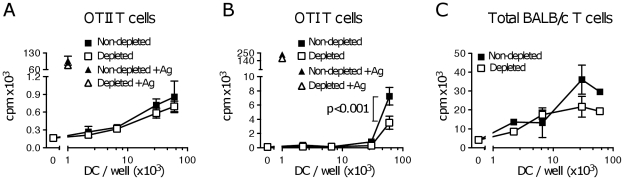
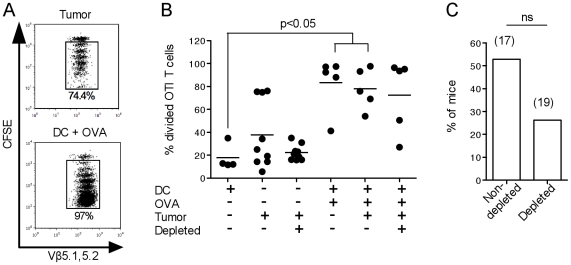
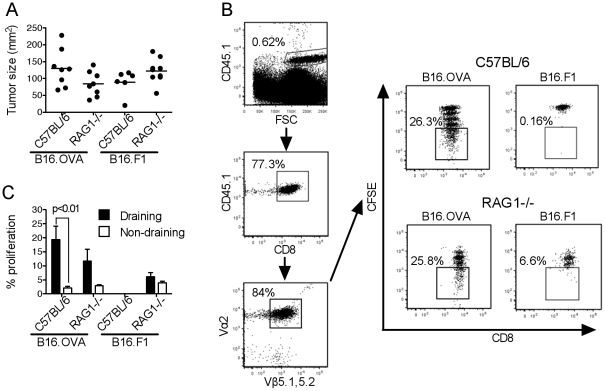
Tumor-infiltrating dendritic cells are often ineffective at presenting tumor-derived antigen in vivo, a defect usually ascribed to the suppressive tumor environment. We investigated the effects of depleting CD4(+)CD25(+) "natural" regulatory T cells (Treg) on the frequency, phenotype and function of total dendritic cell populations in B16.OVA tumors and in tumor-draining lymph nodes. Intraperitoneal injection of the anti-CD25 monoclonal antibody PC61 reduced Treg frequency in blood and tumors, but did not affect the frequency of tumor-infiltrating dendritic cells, or their expression of CD40, CD86 and MHCII. Tumor-infiltrating dendritic cells from PC61-treated or untreated mice induced the proliferation of allogeneic T cells in vitro, but could not induce proliferation of OVA-specific OTI and OTII T cells unless specific peptide antigen was added in culture. Some proliferation of naïve, OVA-specific OTI T cells, but not OTII T cells, was observed in the tumor-draining LN of mice carrying B16.OVA tumors, however, this was not improved by PC61 treatment. Experiments using RAG1(-/-) hosts adoptively transferred with OTI and CD25-depleted OTII cells also failed to show improved OTI and OTII T cell proliferation in vivo compared to C57BL/6 hosts. We conclude that the defective presentation of B16.OVA tumor antigen by tumor-infiltrating dendritic cells and in the tumor-draining lymph node is not due to the presence of "natural" CD4(+)CD25(+) Treg.


Conflict of interest statement

Competing Interests: The authors have declared that no competing interests exist.

Figures

Figure 1
Figure 1. Tumor-infiltrating Foxp3+ Treg are suppressive in vitro and affect tumor growth.
Foxp3GFP mice were treated with PC61 or left untreated, and injected with B16.OVA tumors s.c. Tissues were removed for analysis at different times after tumor challenge. (A) The frequencies of Treg in tumors from non-depleted mice, or mice depleted of Treg by PC61 treatment, were determined by flow cytometry. Each panel refers to an individual representative mouse. (B, C) Frequencies of Foxp3GFP+ cells in different tissues (B) and in tumors of different sizes (C), determined as shown in panel A. Each dot represents one mouse. Data are from 2 experiments, each with 4–5 mice per group, collected 14–17 days after tumor inoculation. Average values are shown by a horizontal line, p values were calculated using one-way ANOVA. (D) Mice were treated with PC61 (solid arrows) or left untreated, and injected with B16.OVA (arrow with broken line). Mice were bled over time to monitor the frequency of Foxp3GFP+ Treg within the peripheral CD4+ population. Average ± SEM for groups of 5 mice are shown. (E) CD4+ Foxp3GFP+ Treg were sorted from tumors and titrated into wells containing constant numbers of purified CD4+CD25 effector T cells, DC, and anti-CD3. Proliferation was measured 3 days later. Bars represent average ± range for duplicate samples. (F) C57BL/6 mice were treated with PC61 as in D or left untreated, and inoculated with tumor. Average tumor sizes ± SEM are shown. Results are from one of 4 repeat experiments that gave similar results. Values of p (where *<0.05 and ***<0.001) were calculated using a non-parametric one-way ANOVA with a Dunn's post-test.
Figure 2
Figure 2. Treg depletion does not affect the frequency or phenotype of TIDC and DC in LN.
C57BL/6 mice were treated with PC61 or left untreated, and injected with B16.OVA s.c. Tumors and LN were removed for analysis at different times after tumor challenge. (A) Gating strategy used to identify TIDC (CD45+, CD11chi, CD11bhi/int) and assess expression of CD40, CD86 and MHCII. Fluorescence-minus-one controls (CD40) and isotype controls (CD86 and MHCII) are shown as grey filled histograms, while empty histograms show marker expression. Percentages of cells expressing the relevant markers are shown. (B) Frequencies of DC in tumors, expressed as % CD11chi cells in the CD45+ population. Each dot corresponds to one mouse. Data are from 3 experiments, each with 4–5 mice per group. (C) Numbers of DC per mg of tumor when tumors in both groups are of similar size (200–300 mg). Bars show the average number of DC+SE from 2 experiments each with 3–4 mice per group. The average tumor size in the two groups was similar. (D) Percentages of TIDC expressing the indicated maturation markers in Treg-depleted and non-depleted mice. Bars show the average+SEM for a compilation of 3 independent experiments each with 5 mice per group. (E) Expression of maturation markers on DC in untreated mice, and in Treg-depleted and non-depleted tumor-bearing mice. Both the tumor-draining and non-draining LN were examined. Averages+SEM from 3 independent experiments each with 5 mice per group are shown.
Figure 3
Figure 3. Treg depletion does not increase the ability of TIDC to stimulate T cell proliferation ex vivo.
C57BL/6 mice were treated with PC61 or left untreated, and injected with B16.OVA s.c. After 14–17 days CD45+ CD11chi TIDC were sorted and titrated in triplicate into cultures containing (A) OTII T cells, (B) OTI T cells or (C) BALB/c allogeneic T cells. As a positive control, specific peptide antigen was loaded on 103 TIDC/well before co-culture with T cells where indicated. Proliferation was measured 3 days later. Each panel shows one of 3 independent experiments that gave similar results. Average ± SEM are shown. p was calculated using a two-way ANOVA test with a Bonferroni post-test.
Figure 4
Figure 4. Treg depletion does not affect the proliferation of tumor-specific T cells in vivo.
C57BL/6 mice were treated with PC61 or left untreated, and injected with B16.OVA s.c. After 13–16 days each mouse was injected with 1.5×10⁶ naïve, CFSE-labeled OTI T cells. LN were removed 3 days later and OTI T cell proliferation was determined by flow cytometry. (A) Representative dot plots of proliferating OTI T cells in the draining LN of tumor-bearing mice (top panel) or non tumor-bearing mice immunized with OVA257–264 -loaded DC (bottom panel). The percent divided cells is shown. (B) Division of OTI T cells in LN draining the tumor or DC immunization site. Where both tumor and DC were given, the LN draining the immunization site was examined. Horizontal lines show the average percentages of divided cells. The graph is representative of 4 independent experiments with 5–10 mice per group per experiment. (C) Percentage of mice showing OTI T cell proliferation in the tumor-draining LN. The total number of mice (n) in each group is shown. Data are compiled from 3 separate experiments; ns, not significant by a Fisher's exact probability test.
Figure 5
Figure 5. The proliferation of tumor-specific OTI T cells in tumor-bearing C57BL/6 and RAG1−/− hosts is similar.
C57BL/6 and RAG1−/− mice were injected with B16.OVA or B16.F1 s.c.. After 15 days each mouse was injected with 1.5×10⁶ naïve, CD8-enriched, CFSE-labeled OTI T cells and 1.5×10⁶ naïve, CD25-depleted, CD4-enriched, CFSE-labeled OTII T cells. LN were removed 3 days later and T cell proliferation was determined by flow cytometry. (A) Tumor size at the experimental endpoint (day 18); each dot corresponds to one mouse and the horizontal line shows the average tumor size. (B) Gating strategy used to identify the donor OTI T cell population in the draining LN. Antigen-specific division was determined on the basis of CFSE dilution as shown in the right-hand dot plots. (C) Antigen-specific OTI T cell division in the tumor-draining and non-draining LN of C57BL/6 and RAG1−/− mice. Bars show the average percentage of cells that divided more than 3 times, +SEM. Data is from one experiment with 6–9 mice per group. p was calculated using two-way ANOVA with a Bonferroni post-test.

References

    1. Vicari AP, Caux C, Trinchieri G. Tumour escape from immune surveillance through dendritic cell inactivation. Semin Cancer Biol. 2002;12:33–42. - PubMed
    1. Chiodoni C, Paglia P, Stoppacciaro A, Rodolfo M, Parenza M, et al. Dendritic cells infiltrating tumors cotransduced with granulocyte/macrophage colony-stimulating factor (GM-CSF) and CD40 ligand genes take up and present endogenous tumor-associated antigens, and prime naive mice for a cytotoxic T lymphocyte response. J Exp Med. 1999;190:125–133. - PMC - PubMed
    1. Stoitzner P, Green LK, Jung JY, Price KM, Ataera H, et al. Inefficient presentation of tumor-derived antigen by tumor-infiltrating dendritic cells. Cancer Immunol Immunother. 2008;57:1665–1673. - PMC - PubMed
    1. Iwamoto M, Shinohara H, Miyamoto A, Okuzawa M, Mabuchi H, et al. Prognostic value of tumor-infiltrating dendritic cells expressing CD83 in human breast carcinomas. Int J Cancer. 2003;104:92–97. - PubMed
    1. Sandel MH, Dadabayev AR, Menon AG, Morreau H, Melief CJ, et al. Prognostic value of tumor-infiltrating dendritic cells in colorectal cancer: role of maturation status and intratumoral localization. Clin Cancer Res. 2005;11:2576–2582. - PubMed

Publication types