

Scaling of brain metabolism with a fixed energy budget per neuron: implications for neuronal activity, plasticity and evolution
- PMID: 21390261
- PMCID: PMC3046985
- DOI: 10.1371/journal.pone.0017514
Scaling of brain metabolism with a fixed energy budget per neuron: implications for neuronal activity, plasticity and evolution
Abstract
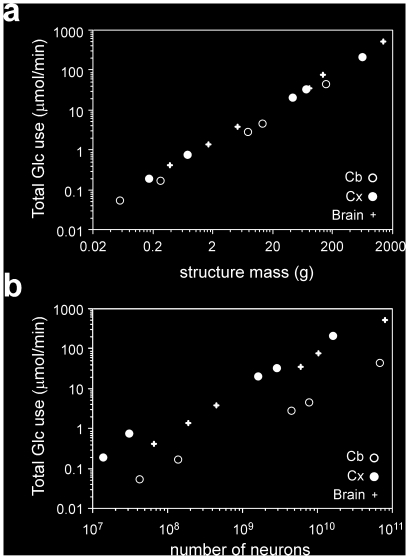
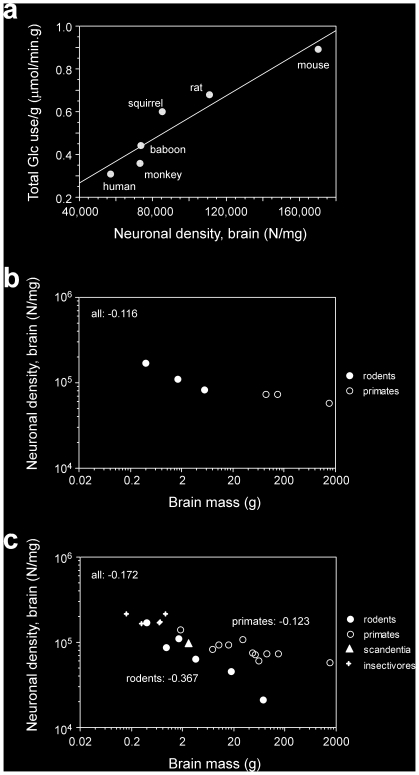
It is usually considered that larger brains have larger neurons, which consume more energy individually, and are therefore accompanied by a larger number of glial cells per neuron. These notions, however, have never been tested. Based on glucose and oxygen metabolic rates in awake animals and their recently determined numbers of neurons, here I show that, contrary to the expected, the estimated glucose use per neuron is remarkably constant, varying only by 40% across the six species of rodents and primates (including humans). The estimated average glucose use per neuron does not correlate with neuronal density in any structure. This suggests that the energy budget of the whole brain per neuron is fixed across species and brain sizes, such that total glucose use by the brain as a whole, by the cerebral cortex and also by the cerebellum alone are linear functions of the number of neurons in the structures across the species (although the average glucose consumption per neuron is at least 10× higher in the cerebral cortex than in the cerebellum). These results indicate that the apparently remarkable use in humans of 20% of the whole body energy budget by a brain that represents only 2% of body mass is explained simply by its large number of neurons. Because synaptic activity is considered the major determinant of metabolic cost, a conserved energy budget per neuron has several profound implications for synaptic homeostasis and the regulation of firing rates, synaptic plasticity, brain imaging, pathologies, and for brain scaling in evolution.
Conflict of interest statement
Figures
References
-
- Aschoff J, Günther B, Kramer K. Energiehaushalt und Temperaturregulation. Munich: Urban and Schwarzenberg; 1971.
-
- Hofman MA. Energy metabolism, brain size and longevity in mammals. Quarterly Rev Biol. 1983;58:495–512. - PubMed
-
- Mink JW, Blumenschine RJ, Adams DB. Ratio of central nervous system to body metabolism in vertebrates: its constancy and functional basis. Am J Physiol. 1981;241:203–212. - PubMed
-
- Sokoloff L. Relation between physiological function and energy metabolism in the central nervous system. J Neurochem. 1977;29:13–26. - PubMed
-
- Kety SS. The general metabolism of the brain in vivo. In: Richter D, editor. Metabolism of the nervous system. London: Pergamon; 1957. pp. 221–237.
Publication types
MeSH terms
Substances
LinkOut - more resources
Full Text Sources
