. 2011 Mar;8(3):e1000423.
doi: 10.1371/journal.pmed.1000423. Epub 2011 Mar 1.

Effectiveness and cost effectiveness of expanding harm reduction and antiretroviral therapy in a mixed HIV epidemic: a modeling analysis for Ukraine

Affiliations

Effectiveness and cost effectiveness of expanding harm reduction and antiretroviral therapy in a mixed HIV epidemic: a modeling analysis for Ukraine

Sabina S Alistar et al. PLoS Med. 2011 Mar.

Abstract

Background: Injection drug use (IDU) and heterosexual virus transmission both contribute to the growing mixed HIV epidemics in Eastern Europe and Central Asia. In Ukraine-chosen in this study as a representative country-IDU-related risk behaviors cause half of new infections, but few injection drug users (IDUs) receive methadone substitution therapy. Only 10% of eligible individuals receive antiretroviral therapy (ART). The appropriate resource allocation between these programs has not been studied. We estimated the effectiveness and cost-effectiveness of strategies for expanding methadone substitution therapy programs and ART in mixed HIV epidemics, using Ukraine as a case study.

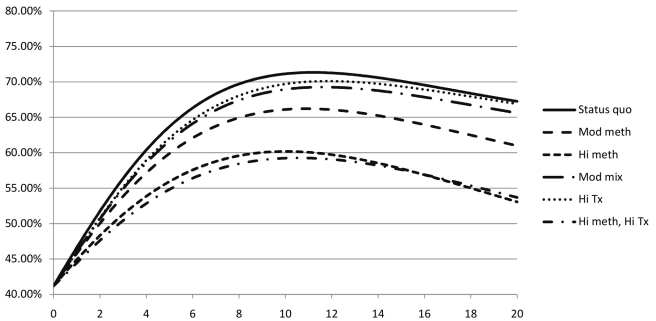
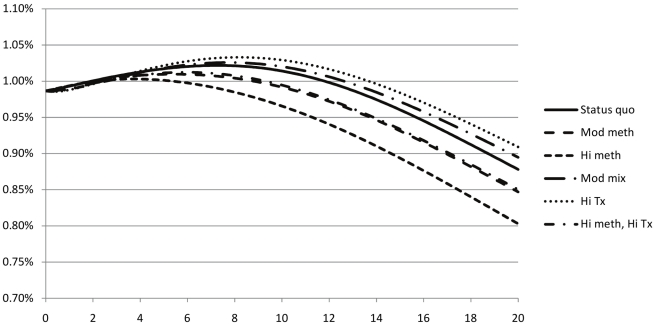
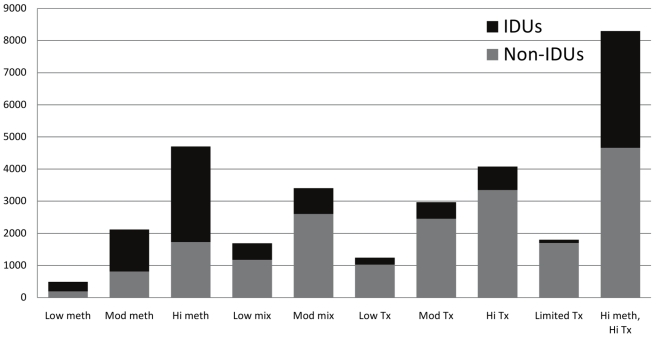
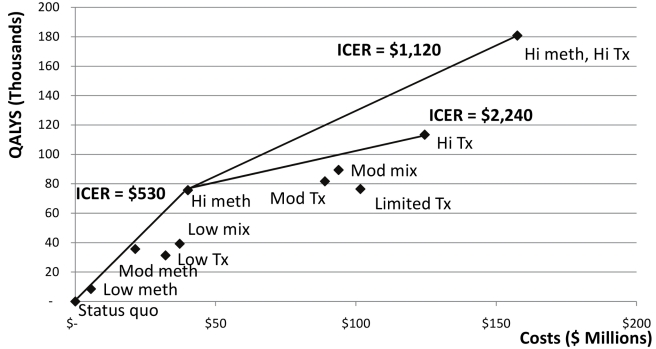
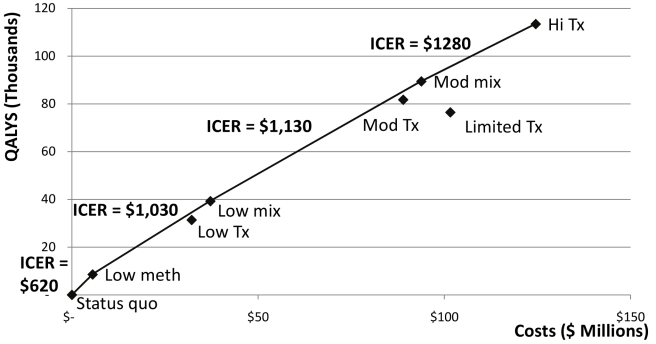
Methods and findings: We developed a dynamic compartmental model of the HIV epidemic in a population of non-IDUs, IDUs using opiates, and IDUs on methadone substitution therapy, stratified by HIV status, and populated it with data from the Ukraine. We considered interventions expanding methadone substitution therapy, increasing access to ART, or both. We measured health care costs, quality-adjusted life years (QALYs), HIV prevalence, infections averted, and incremental cost-effectiveness. Without incremental interventions, HIV prevalence reached 67.2% (IDUs) and 0.88% (non-IDUs) after 20 years. Offering methadone substitution therapy to 25% of IDUs reduced prevalence most effectively (to 53.1% IDUs, 0.80% non-IDUs), and was most cost-effective, averting 4,700 infections and adding 76,000 QALYs compared with no intervention at US$530/QALY gained. Expanding both ART (80% coverage of those eligible for ART according to WHO criteria) and methadone substitution therapy (25% coverage) was the next most cost-effective strategy, adding 105,000 QALYs at US$1,120/QALY gained versus the methadone substitution therapy-only strategy and averting 8,300 infections versus no intervention. Expanding only ART (80% coverage) added 38,000 QALYs at US$2,240/QALY gained versus the methadone substitution therapy-only strategy, and averted 4,080 infections versus no intervention. Offering ART to 80% of non-IDUs eligible for treatment by WHO criteria, but only 10% of IDUs, averted only 1,800 infections versus no intervention and was not cost effective.

Conclusions: Methadone substitution therapy is a highly cost-effective option for the growing mixed HIV epidemic in Ukraine. A strategy that expands both methadone substitution therapy and ART to high levels is the most effective intervention, and is very cost effective by WHO criteria. When expanding ART, access to methadone substitution therapy provides additional benefit in infections averted. Our findings are potentially relevant to other settings with mixed HIV epidemics. Please see later in the article for the Editors' Summary.


Conflict of interest statement

DKO received an honorarium from Quintiles to prepare a continuing medical education lecture about HIV screening. No other competing interests have been declared.

Figures

Figure 1
Figure 1. Evolution of estimated HIV prevalence among IDUs in Ukraine for various strategies to expand methadone substitution therapy and ART access.
Status quo, no methadone substitution therapy slots, 10% of eligible non-IDUs on ART, 2% of eligible IDUs on ART; Mod meth, 12.5% of IDUs on methadone substitution therapy, ART according to status quo except 25% of eligible IDUs on methadone substitution therapy on ART; Hi meth, 25% of IDUs on methadone substitution therapy, ART according to status quo except 25% of eligible IDUs on methadone substitution therapy on ART; Mod mix, 3.1% of IDUs on methadone substitution therapy, 50% of all eligible patients on ART; Hi tx, no methadone substitution therapy slots, 80% of all eligible patients on ART; Hi meth, Hi tx, 25% of IDUs on methadone substitution therapy, 80% of all eligible patients on ART.
Figure 2
Figure 2. Evolution of estimated HIV prevalence among non-IDUs in Ukraine for various strategies to expand methadone substitution therapy substitution therapy and ART access.
Status quo, no methadone substitution therapy slots, 10% of eligible non-IDUs on ART, 2% of eligible IDUs on ART; Mod meth, 12.5% of IDUs on methadone substitution therapy, ART according to status quo except 25% of eligible IDUs on methadone substitution therapy on ART; Hi meth, 25% of IDUs on methadone substitution therapy, ART according to status quo except 25% of eligible IDUs on methadone substitution therapy on ART; Mod mix, 3.1% of IDUs on methadone substitution therapy, 50% of all eligible patients on ART; Hi tx, no methadone substitution therapy slots, 80% of all eligible patients on ART; Hi meth, Hi tx, 25% of IDUs on methadone substitution therapy, 80% of all eligible patients on ART.
Figure 3
Figure 3. Estimated number of HIV infections averted over 20 y among IDUs and non-IDUs for strategies to expand methadone substitution therapy and ART access in Ukraine.
Low meth, 3.1% of IDUs on methadone substitution therapy, ART according to status quo except 25% of eligible IDUs on methadone substitution therapy on ART; Mod meth, 12.5% of IDUs on methadone substitution therapy, ART according to status quo except 25% of eligible IDUs on methadone substitution therapy on ART; Hi meth, 25% of IDUs on methadone substitution therapy, ART according to status quo except 25% of eligible IDUs on methadone substitution therapy on ART; Low mix, 3.1% of IDUs on methadone substitution therapy, 20% of eligible non-IDUs and IDUs not on methadone substitution therapy on ART, 25% of IDUs on methadone substitution therapy on ART; Mod mix, 3.1% of IDUs on methadone substitution therapy, 50% of all eligible patients on ART; Low tx, no methadone substitution therapy slots, 20% of all eligible patients on ART; Mod tx, no methadone substitution therapy slots, 50% of all eligible patients on ART; Hi tx, no methadone substitution therapy slots, 80% of all eligible patients on ART; Limited tx, no methadone substitution therapy slots, 80% of eligible non-IDUs on ART, 10% of eligible IDUs on ART; Hi meth, hi tx, 25% of IDUs on methadone substitution therapy, 80% of all eligible patients on ART.
Figure 4
Figure 4. Cost effectiveness of various strategies for scaling up methadone substitution therapy and ART access in Ukraine, assuming that scaling up methadone substitution therapy is a feasible option.
Status quo, no methadone substitution therapy slots, 10% of eligible non-IDUs on ART, 2% of eligible IDUs on ART; Low meth, 3.1% of IDUs on methadone substitution therapy, ART according to status quo except 25% of eligible IDUs on methadone substitution therapy on ART; Mod meth, 12.5% of IDUs on methadone substitution therapy, ART according to status quo except 25% of eligible IDUs on methadone substitution therapy on ART; Hi meth, 25% of IDUs on methadone substitution therapy, ART according to status quo except 25% of eligible IDUs on methadone substitution therapy on ART; Low mix, 3.1% of IDUs on methadone substitution therapy, 20% of eligible non-IDUs and IDUs not on methadone substitution therapy on ART, 25% of IDUs on methadone substitution therapy on ART; Mod mix, 3.1% of IDUs on methadone substitution therapy, 50% of all eligible patients on ART; Low tx, no methadone substitution therapy slots, 20% of all eligible patients on ART; Mod tx, no methadone substitution therapy slots, 50% of all eligible patients on ART; Hi tx, no methadone substitution therapy slots, 80% of all eligible patients on ART; Limited tx, no methadone substitution therapy slots, 80% of eligible non-IDUs on ART, 10% of eligible IDUs on ART; Hi meth, Hi tx, 25% of IDUs on methadone substitution therapy, 80% of all eligible patients on ART.
Figure 5
Figure 5. Cost effectiveness of various strategies for scaling up methadone substitution therapy and ART access in Ukraine, assuming that only a low level of methadone substitution therapy (3.1% of IDUs on methadone substitution therapy) is feasible.
Status quo, no methadone substitution therapy slots, 10% of eligible non-IDUs on ART, 2% of eligible IDUs on ART; Low meth, 3.1% of IDUs on methadone substitution therapy, ART according to status quo except 25% of eligible IDUs on methadone substitution therapy on ART; Mod meth, 12.5% of IDUs on methadone substitution therapy, ART according to status quo except 25% of eligible IDUs on methadone substitution therapy on ART; Hi meth, 25% of IDUs on methadone substitution therapy, ART according to status quo except 25% of eligible IDUs on methadone substitution therapy on ART; Low mix, 3.1% of IDUs on methadone substitution therapy, 20% of eligible non-IDUs and IDUs not on methadone substitution therapy on ART, 25% of IDUs on methadone substitution therapy on ART; Mod mix, 3.1% of IDUs on methadone substitution therapy, 50% of all eligible patients on ART; Low tx, no methadone substitution therapy slots, 20% of all eligible patients on ART; Mod tx, no methadone substitution therapy slots, 50% of all eligible patients on ART; Hi tx, no methadone substitution therapy slots, 80% of all eligible patients on ART; Limited tx, no methadone substitution therapy slots, 80% of eligible non-IDUs on ART, 10% of eligible IDUs on ART; Hi meth, Hi tx, 25% of IDUs on methadone substitution therapy, 80% of all eligible patients on ART.

References

    1. Mathers BM, Degenhardt L, Phillips B, Wiessing L, Hickman M, et al. Global epidemiology of injecting drug use and HIV among people who inject drugs: a systematic review. Lancet. 2008;372:1733–1745. - PubMed
    1. Celentano DD, Beyrer C, Wolfe D, Elovich R, Boltaev A, et al. Public health aspects of HIV/AIDS in low and middle income countries. New York: Springer; 2008. HIV in Central Asia: Tajikistan, Uzbekistan and Kyrgyzstan. pp. 557–581.
    1. Joint United Nations Programme on HIV/AIDS (UNAIDS) Geneva: United Nations; 2008. Ukraine - National report on monitoring progress towards the UNGASS declaration of commitment on HIV/AIDS.
    1. Kruglov YV, Kobyshcha YV, Salyuk T, Varetska O, Shakarishvili A, et al. The most severe HIV epidemic in Europe: Ukraine's national HIV prevalence estimates for 2007. Sex Transm Infect. 2008;84:i37–i41. - PMC - PubMed
    1. Hamers FF, Downs AM. HIV in central and eastern Europe. Lancet. 2003;361:1035–1044. - PubMed

Publication types

MeSH terms