. 2011 Mar;7(3):e1001098.
doi: 10.1371/journal.pcbi.1001098. Epub 2011 Mar 3.

Nucleotide binding switches the information flow in ras GTPases

Affiliations

Nucleotide binding switches the information flow in ras GTPases

Francesco Raimondi et al. PLoS Comput Biol. 2011 Mar.

Abstract

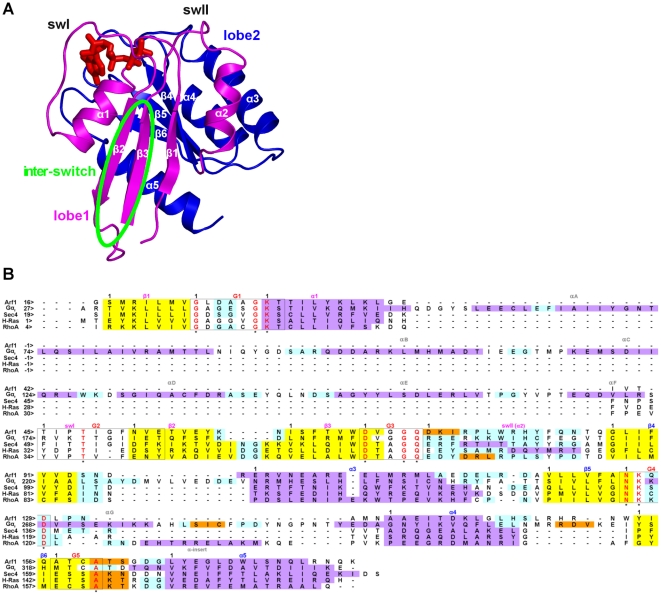
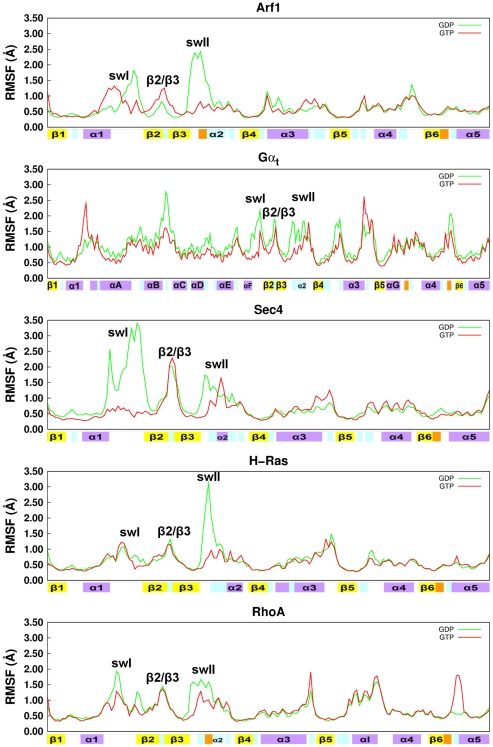
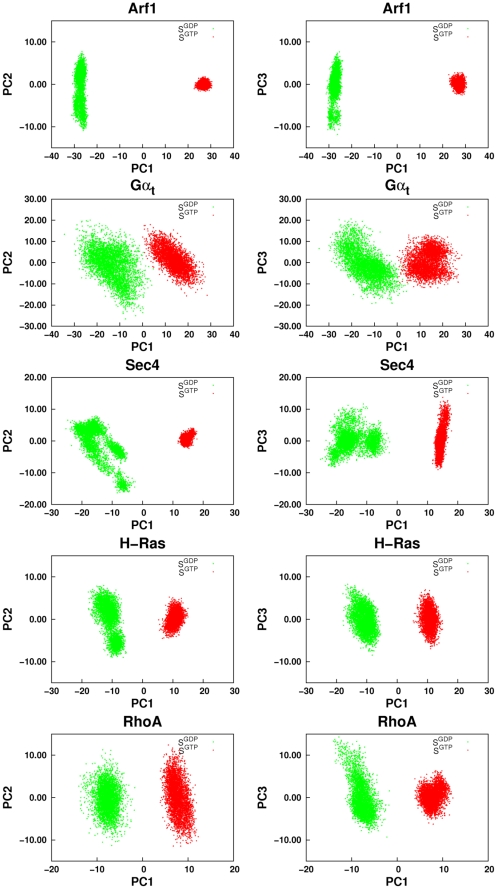
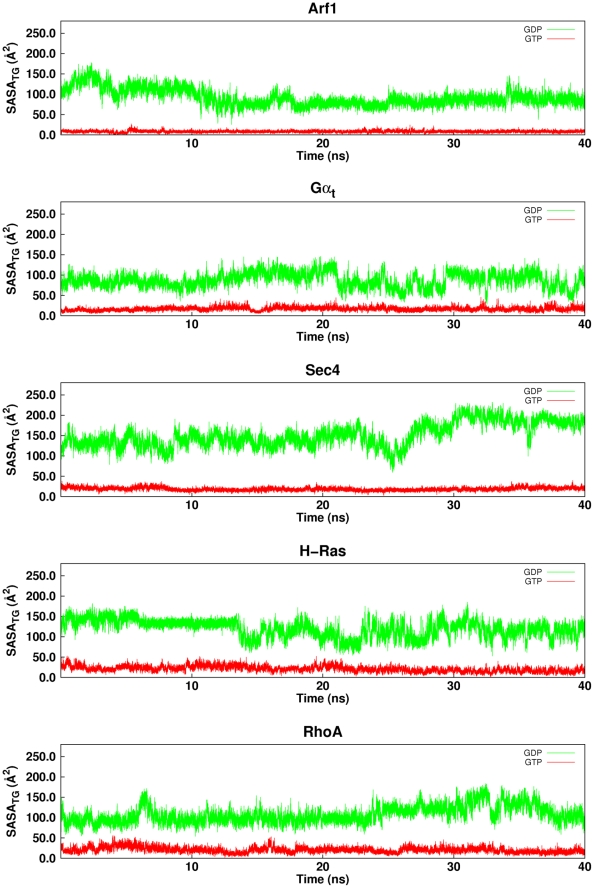
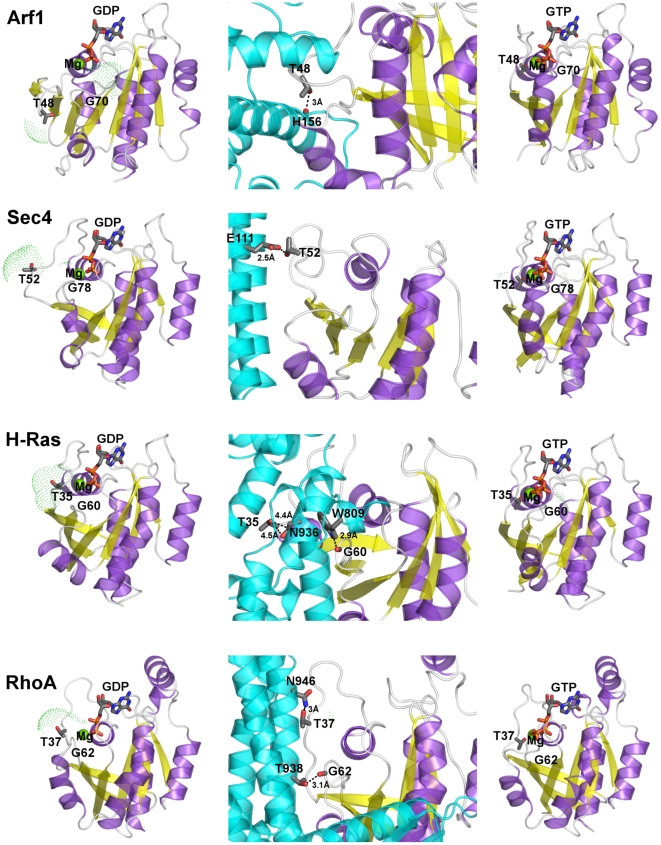
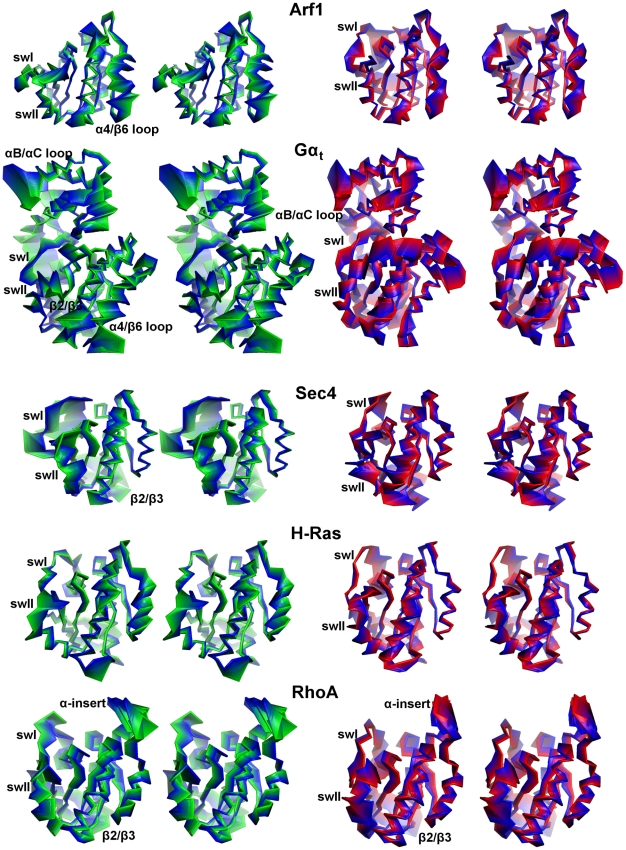
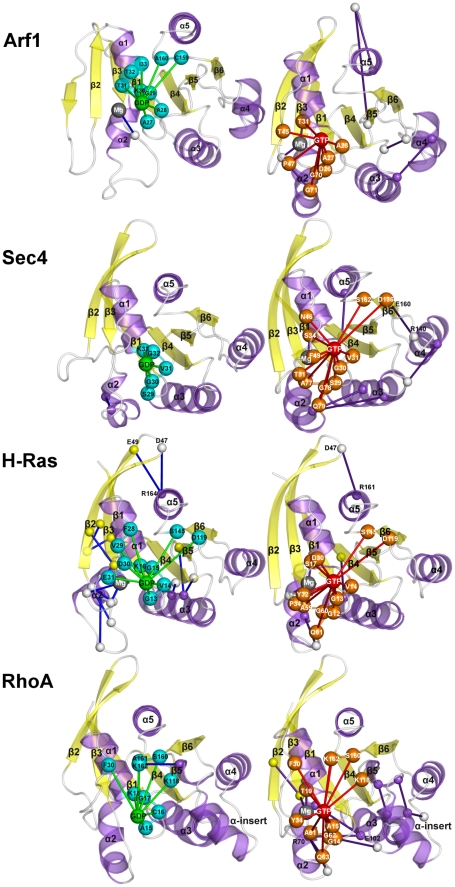
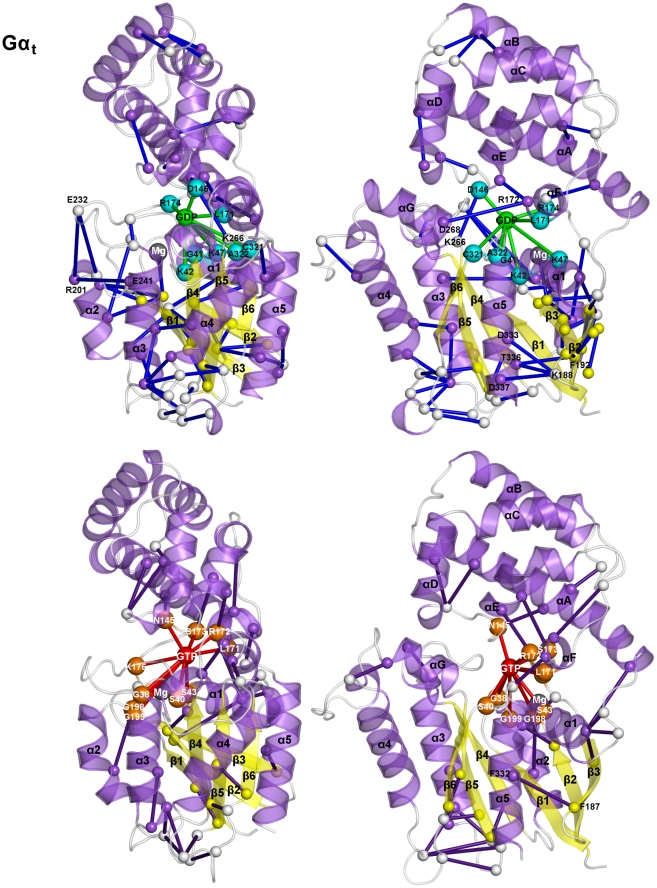
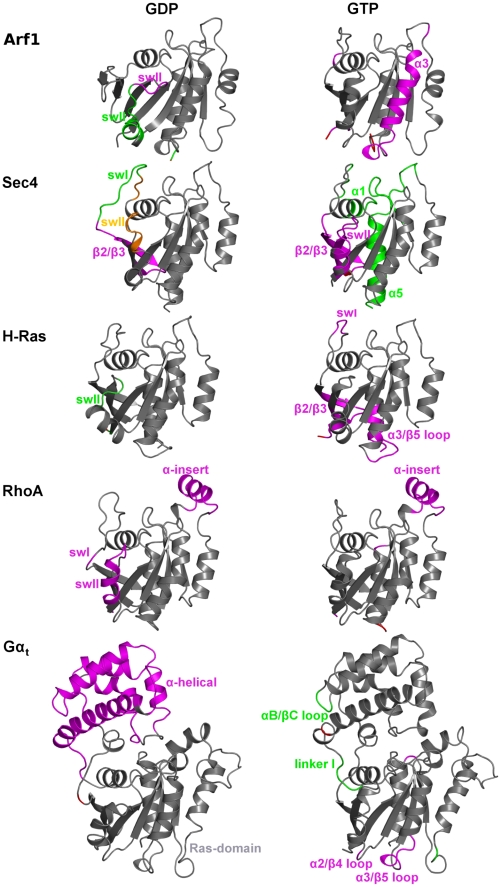
The Ras superfamily comprises many guanine nucleotide-binding proteins (G proteins) that are essential to intracellular signal transduction. The guanine nucleotide-dependent intrinsic flexibility patterns of five G proteins were investigated in atomic detail through Molecular Dynamics simulations of the GDP- and GTP-bound states (S(GDP) and S(GTP), respectively). For all the considered systems, the intrinsic flexibility of S(GDP) was higher than that of S(GTP), suggesting that Guanine Exchange Factor (GEF) recognition and nucleotide switch require higher amplitude motions than effector recognition or GTP hydrolysis. Functional mode, dynamic domain, and interaction energy correlation analyses highlighted significant differences in the dynamics of small G proteins and Gα proteins, especially in the inactive state. Indeed, S(GDP) of Gα(t), is characterized by a more extensive energy coupling between nucleotide binding site and distal regions involved in GEF recognition compared to small G proteins, which attenuates in the active state. Moreover, mechanically distinct domains implicated in nucleotide switch could be detected in the presence of GDP but not in the presence of GTP. Finally, in small G proteins, functional modes are more detectable in the inactive state than in the active one and involve changes in solvent exposure of two highly conserved amino acids in switches I and II involved in GEF recognition. The average solvent exposure of these amino acids correlates in turn with the rate of GDP release, suggesting for them either direct or indirect roles in the process of nucleotide switch. Collectively, nucleotide binding changes the information flow through the conserved Ras-like domain, where GDP enhances the flexibility of mechanically distinct portions involved in nucleotide switch, and favors long distance allosteric communication (in Gα proteins), compared to GTP.


Conflict of interest statement

The authors have declared that no competing interests exist.

Figures

Figure 1
Figure 1. Structure and sequence features of the five GTPases.
A: cartoons of the H-Ras structure (PDB code: 5P21) in its GTP-bound state are shown. The Ras superfamily GTPases share a common domain, the Ras-like domain. The latter, according to CATH , is characterized by a Rossmann fold with a 3-layer(αβα) sandwich architecture, where helices 1 and 5 (α1 and α5; the secondary structure elements in the Ras-like domain are labeled according to the Noel's nomenclature [35]) lay on one side, whereas α2, α3, and α4 lay on the other side of the central five-stranded parallel β-sheet (i.e. comprising the β1 and β3-β6 strands, Figures 1 and 2). The helices α1 and α3 lay on the opposite side of the sheet due to the inversion in the order of the preceding strands, β1 and β3, respectively, which are adjacent to each other. The β1/α1 loop, i.e. phosphate binding loop (P loop), and the region comprising α2 as well as the preceding and following loops (i.e. switch II (swII)) participate in the binding of the nucleotide phosphates (Figures 1 and 2). The architecture of this superfamily is such that β1 is also adjacent to β4. The β1/β4 interface divides the Ras-like domain into two lobes: i) lobe 1 (i.e. the N-terminal half of the domain, magenta) includes the β1-β3 strands, the P-loop and the two switches, and ii) lobe 2 (blue), which includes the β4-β6 strands and the α3-α5 helices. Another structural feature of the conserved Ras domain is that β2 forms a β-hairpin with β3, the loop that connects the two antiparallel strands being directed towards the opposite side of the nucleotide binding cleft (Figures 1 and 2) . The β2/β3 hairpin is also called “inter-switch” (i.e. delimited by a green oval) because the loops that enter β2 and exit from β3 constitute, respectively, the swI and swII regions. The loops connected to the C-term of β1 and the N-term of β2, P loop and swI, respectively, define most of the nucleotide binding site. The members of the Gα family hold an extra-Ras α-helical domain constituted by a long central helix surrounded by five shorter helices. The interface between α-helical and Ras-like domain constitutes the nucleotide binding cleft. Incidentally, among the small G proteins RhoA has a structural peculiarity consisting of a ten amino acid α-helical insertion (α-insert) on the β5/α4 loop like the αG segment shared by the members of the Gα family. B): the multiple sequence alignment derived from the multiple structure alignment of representatives of the SGTP state of Arf1 (PDB code: 1O3Y), Gαt (PDB code: 1TND), Sec4 (PDB code: 1G17), H-Ras (PDB code: 5Q21), and RhoA (PDB code: 1KMQ) is shown (i.e. achieved by the Multiprot-Staccato software) . Helices, strands, and loops are, respectively, violet, yellow, and cyan. Ultra-conserved sequences involved in nucleotide binding (G boxes) are delimited by black boxes. Black numbers on the left side of the alignment refer to the sequential numbering, whereas black numbers above the sequences indicate the beginning of a secondary structure/G box motif. The fully conserved residues in such boxes are red and marked by an asterisk. In order to facilitate trans-family comparisons of the MD simulation outputs, an arbitrary numbering was set characterized by the label of the secondary structure segment followed by the amino acid position in that segment. In those cases where the G-boxes overlap with the secondary structure segment, positions refer to the G-boxes.
Figure 2
Figure 2. Structural features of the five GTPases.
Cartoons of the SGTP state of Arf1 (PDB code: 1O3Y), Gαt (PDB code: 1TND), Sec4 (PDB code: 1G17), H-Ras (PDB code: 5Q21), and RhoA (PDB code: 1KMQ) are shown. The structures are colored according to secondary structure. The nucleotide is represented by sticks colored by atom type. Selected side chains of amino acids conserved in groups of G protein families are shown by sticks. Structural analysis, indeed, reveals clusters of conserved amino acids shared by selected family members. In particular, Sec4, H-Ras, and RhoA share a cluster of conserved aromatic/hydrophobic amino acids at positions β4∶6, α3∶4, α4∶7, and α4∶11 as well as a glutamate in position G5∶1, which is engaged in a salt bridge with an arginine on the β5/α4 loop that holds the same conservation pattern of the glutamate. In contrast, Arf1 and Gαt share a cluster of hydrophobic/aromatic amino acids at positions β4∶4, α3∶13, and α4∶8 (Figure 2). Another feature that distinguishes Arf1 and Gαt from the other three G proteins is the α4/β6 loop that is significantly longer in the former.
Figure 3
Figure 3. RMSF profile from MD trajectories of the SGDP and SGTP forms of the five Ras GTPases.
Green and red lines refer to the SGDP and SGTP forms, respectively, of Arf1, Gαt, Sec4, H-Ras, and RhoA. RMSF profiles refer to the 40000 frames constituting 40 ns trajectories. The secondary structure elements are shown on the abscissa, following nomenclature and color code described in Figure 1.
Figure 4
Figure 4. Results of PCA on the concatenated 40 ns trajectories of the inactive and active states.
Frame displacements along the first three PCs derived from the concatenated trajectories of the SGDP (green) and SGTP (red) representatives of the Arf1, Gαt, Sec4, H-Ras, and RhoA families are shown. In detail, PC1 has been plotted both against PC2 (left panel) and PC3 (right panel).
Figure 5
Figure 5. Time series of the SASA index.
Time series of the SASA index computed over T(G2∶4) and G(G3∶4) (SASABP) are shown for the SGDP (green lines) and SGTP (red lines) representatives of the five considered GTPases.
Figure 6
Figure 6. Cartoons of three different functional forms of the five GTPases.
Left, central, and right panels show, respectively, the GDP-, GEF-, and GTP-bound forms of Arf1, Sec4, H-Ras, and RhoA. The GEF protein is colored cyan with helices represented as cylinders. The SASA computed on T(G2∶4) and G(G3∶4) is shown by green dots. The T(G2∶4) side chain and the nucleotide are represented as sticks. Dashed lines indicate the distances between either the side chain oxygen atom of T(G2∶4) or the backbone oxygen atom of G(G3∶4) and an interacting partner on the GEF molecule.
Figure 7
Figure 7. Cα-atoms projections along the first 20 PCs.
The Cα-atoms projections along the linear combination of the first twenty PCs from the trajectories referred to the SGDP (left) and SGTP (right) states are shown.
Figure 8
Figure 8. Nucleotide-protein interaction energies correlated with protein-protein interaction energies.
Cartoons of the SGDP (left panels) and SGTP (right panels) states of the four small G proteins are shown. Proteins are colored according to secondary structure. Correlated amino acid pairs are indicated by spheres centered on the Cα-atoms and connected by lines. GDP and GTP are, respectively, represented as green and red spheres centered on the ribose C4′ atom. The spheres concerning the amino acids of the GDP and GTP binding sites are cyan and orange, respectively, whereas that concerning the Mg2+ ion is gray. Lines that involve the nucleotide sphere are green and red for the SGDP and SGTP forms, respectively. The spheres concerning the correlated amino acid pairs not directly involved in interaction with the nucleotide are white, smaller than those of the nucleotide binding site, and connected by blue and violet lines in the SGDP and SGTP states, respectively. For Arf1, coupled amino acids pairs are found between α3 and α4, between α3/β5 loop and α5 (C-term), and within the C-term of the SGTP state. For Sec4, the almost absent correlated pairs in the SGDP form are replaced by interactions between swII and α3, between α3 and α4, between α3/β5 loop and α5 C-term, and between β5/α4 loop and β6 (Figure 8). Remarkably, the latter amino acid pair, energetically coupled with the pair S29(G1∶3)-GTP, involves R140 in the β5/α4 loop and E160(G5∶1) conserved in the Sec4, H-Ras, and RhoA sequences. Similar to the other small G proteins, RhoA activation, tends to increase the swII-α3 correlated connectivities, which include the R70(swII∶7)-E102(α3∶14) ion pair. The latter presumably contributes to increase the α3-bending already observed in the SGDP state. Other coupled pairs in the active form locate on the α-insert.
Figure 9
Figure 9. Nucleotide-protein interaction energies correlated with protein-protein interaction energies for Gαt.
The explanation of this Figure is the same as that of Figure 8, with the difference that in this Figure two different side views for each functional form of Gαt are shown. Intra-Ras correlated pairs are both intra-lobe and inter-lobe located. In deep detail, intra-lobe 1 pairs which are close to the nucleotide binding site, are located: a) between β2 and β3 strands; b) between swI and swII; c) intra-swII; and d) between swII and β3. Different from the intra-lobe 1 pairs, intra-lobe 2 pairs are essentially distal from the nucleotide. Some of them locate between α3, on one side, and β4/α3, α3/β5 loop, α4/β6 loop as well as α4, on the other one. Other intra-lobe 2 pairs involve β5 and α4/β6 loop as well as α4 and β6/α5 loop. Inter-lobe correlated pairs essentially involve swII, R201(swII∶1) being paired with both E241(α3∶5) (corresponding to E102(α3∶5) in Arf1) and E232 in the β4/α3 loop. Other noticeable inter-lobe correlated pairs, distal from the nucleotide binding site, involve the β2/β3 hairpin and α5. In detail, K188 in the β2/β3 turn is involved in correlated pairs with D333(α5∶6), T336(α5∶9), and D337(α5∶10), whereas F192(β3∶3) is paired with T336(α5∶9).
Figure 10
Figure 10. Domain representation according to Dynamic Domain analysis.
Cartoon representations of the SGDP (right panel) and SGTP (left panel) representatives of the five families are shown. The coloring scheme highlights protein portions that belong to mechanically coherent domains. The first (i.e. the biggest one) domain is gray, the second is magenta, the third is green, the fourth is orange and the fifth is red. Portions clustered separately from the first domain are labeled accordingly.

References

    1. Vetter IR, Wittinghofer A. The guanine nucleotide-binding switch in three dimensions. Science. 2001;294:1299–1304. - PubMed
    1. Colicelli J. Human RAS superfamily proteins and related GTPases. Sci STKE. 2004;2004:RE13. - PMC - PubMed
    1. Oldham WM, Hamm HE. Structural basis of function in heterotrimeric G proteins. Q Rev Biophys. 2006;39:117–166. - PubMed
    1. Futatsugi N, Tsuda M. Molecular dynamics simulations of Gly-12—>Val mutant of p21(ras): dynamic inhibition mechanism. Biophys J. 2001;81:3483–3488. - PMC - PubMed
    1. Gorfe AA, Grant BJ, McCammon JA. Mapping the nucleotide and isoform-dependent structural and dynamical features of ras proteins. Structure. 2008;16:885–896. - PMC - PubMed

Publication types