. 2011 Mar 10:12:145.
doi: 10.1186/1471-2164-12-145.

QTL mapping in white spruce: gene maps and genomic regions underlying adaptive traits across pedigrees, years and environments

Affiliations

QTL mapping in white spruce: gene maps and genomic regions underlying adaptive traits across pedigrees, years and environments

Betty Pelgas et al. BMC Genomics. .

Abstract

Background: The genomic architecture of bud phenology and height growth remains poorly known in most forest trees. In non model species, QTL studies have shown limited application because most often QTL data could not be validated from one experiment to another. The aim of our study was to overcome this limitation by basing QTL detection on the construction of genetic maps highly-enriched in gene markers, and by assessing QTLs across pedigrees, years, and environments.

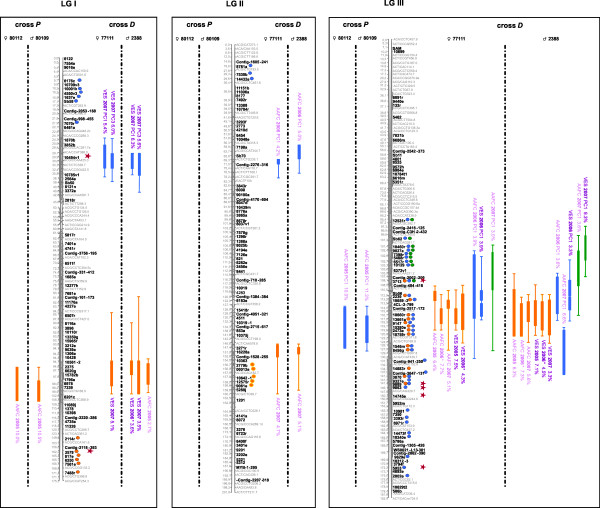
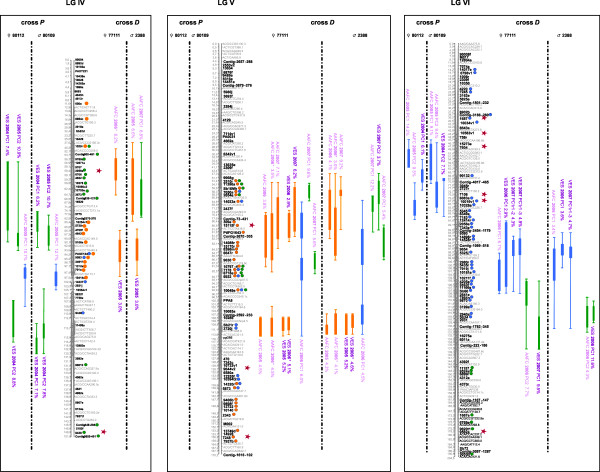
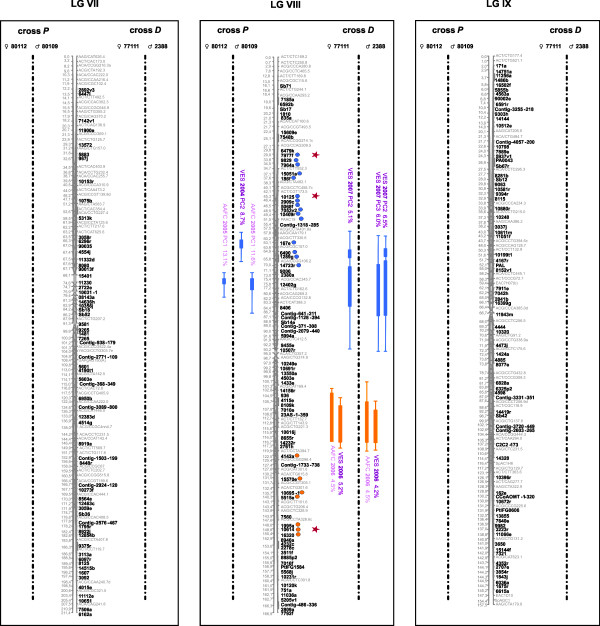
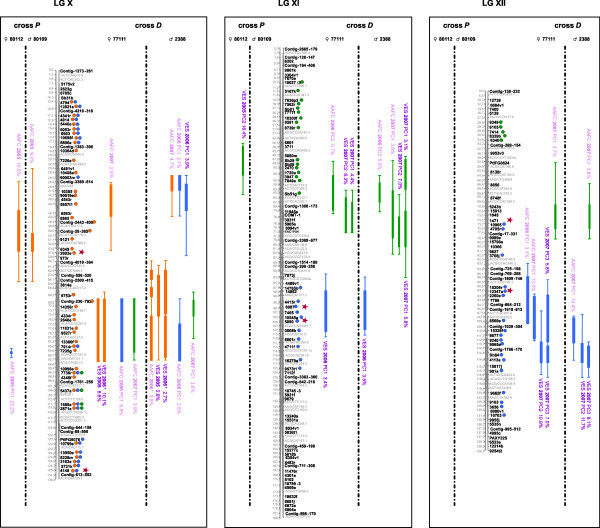
Results: Four saturated individual linkage maps representing two unrelated mapping populations of 260 and 500 clonally replicated progeny were assembled from 471 to 570 markers, including from 283 to 451 gene SNPs obtained using a multiplexed genotyping assay. Thence, a composite linkage map was assembled with 836 gene markers.For individual linkage maps, a total of 33 distinct quantitative trait loci (QTLs) were observed for bud flush, 52 for bud set, and 52 for height growth. For the composite map, the corresponding numbers of QTL clusters were 11, 13, and 10. About 20% of QTLs were replicated between the two mapping populations and nearly 50% revealed spatial and/or temporal stability. Three to four occurrences of overlapping QTLs between characters were noted, indicating regions with potential pleiotropic effects. Moreover, some of the genes involved in the QTLs were also underlined by recent genome scans or expression profile studies.Overall, the proportion of phenotypic variance explained by each QTL ranged from 3.0 to 16.4% for bud flush, from 2.7 to 22.2% for bud set, and from 2.5 to 10.5% for height growth. Up to 70% of the total character variance could be accounted for by QTLs for bud flush or bud set, and up to 59% for height growth.

Conclusions: This study provides a basic understanding of the genomic architecture related to bud flush, bud set, and height growth in a conifer species, and a useful indicator to compare with Angiosperms. It will serve as a basic reference to functional and association genetic studies of adaptation and growth in Picea taxa. The putative QTNs identified will be tested for associations in natural populations, with potential applications in molecular breeding and gene conservation programs. QTLs mapping consistently across years and environments could also be the most important targets for breeding, because they represent genomic regions that may be least affected by G × E interactions.


Figures

Figure 1
Figure 1
Genomic architecture of adaptive traits in white spruce: distribution of QTLs significantly associated to bud flush, bud set, and height growth on linkage groups I to III of the composite map of white spruce assembled from both mapping populations P (♀ 80112 × ♂ 80109) and D (♀ 77111 × ♂ 2388). Genetic distances are indicated in cM (Kosambi) at the left of each linkage group. QTLs for bud flush, bud set and height growth are indicated by green, blue, and orange circles and bars, respectively. Thin and large vertical bars of each QTL correspond respectively to -1LOD and -2LOD confidence intervals and are positioned compared to marker position on central bar of each linkage group. Circles identify gene markers associated to each -1LOD confidence interval of each QTL. Note that because of the dense positioning of markers, physical position of circles and confidence intervals can not be plotted beside each other. QTL names correspond to environmental condition (indoor = AAFC or outdoor = VES), year and for bud flush and bud set, principal component identifying each QTL, i.e. PC1, PC2 or PC3 (Table 2). An asterisk was added for QTLs identified from total height growth in order to distinguish them to QTLs identified for annual height growth in 2006 for the cross D. Red stars indicate the correspondence between QTL-marker and outlier candidate gene SNPs involved in local adaption for white spruce [108].
Figure 2
Figure 2
Genomic architecture of adaptive traits in white spruce: distribution of QTLs significantly associated to bud flush, bud set, and height growth on linkage groups IV to VI of the composite map of white spruce assembled from both mapping populations P (♀ 80112 × ♂ 80109) and D (♀ 77111 × ♂ 2388). Genetic distances are indicated in cM (Kosambi) at the left of each linkage group. QTLs for bud flush, bud set and height growth are indicated by green, blue, and orange circles and bars, respectively. Thin and large vertical bars of each QTL correspond respectively to -1LOD and -2LOD confidence intervals and are positioned compared to marker position on central bar of each linkage group. Circles identify gene markers associated to each -1LOD confidence interval of each QTL. Note that because of the dense positioning of markers, physical position of circles and confidence intervals can not be plotted beside each other. QTL names correspond to environmental condition (indoor = AAFC or outdoor = VES), year and for bud flush and bud set, principal component identifying each QTL, i.e. PC1, PC2 or PC3 (Table 2). An asterisk was added for QTLs identified from total height growth in order to distinguish them to QTLs identified for annual height growth in 2006 for the cross D. Red stars indicate the correspondence between QTL-marker and outlier candidate gene SNPs involved in local adaption for white spruce [108].
Figure 3
Figure 3
Genomic architecture of adaptive traits in white spruce: distribution of QTLs significantly associated to bud flush, bud set, and height growth on linkage groups VII to IX of the composite map of white spruce assembled from both mapping populations P (♀ 80112 × ♂ 80109) and D (♀ 77111 × ♂ 2388). Genetic distances are indicated in cM (Kosambi) at the left of each linkage group. QTLs for bud flush, bud set and height growth are indicated by green, blue, and orange circles and bars, respectively. Thin and large vertical bars of each QTL correspond respectively to -1LOD and -2LOD confidence intervals and are positioned compared to marker position on central bar of each linkage group. Circles identify gene markers associated to each -1LOD confidence interval of each QTL. Note that because of the dense positioning of markers, physical position of circles and confidence intervals can not be plotted beside each other. QTL names correspond to environmental condition (indoor = AAFC or outdoor = VES), year and for bud flush and bud set, principal component identifying each QTL, i.e. PC1, PC2 or PC3 (Table 2). An asterisk was added for QTLs identified from total height growth in order to distinguish them to QTLs identified for annual height growth in 2006 for the cross D. Red stars indicate the correspondence between QTL-marker and outlier candidate gene SNPs involved in local adaption for white spruce [108]
Figure 4
Figure 4
Genomic architecture of adaptive traits in white spruce: distribution of QTLs significantly associated to bud flush, bud set, and height growth on linkage groups X to XII of the composite map of white spruce assembled from both mapping populations P (♀ 80112 × ♂ 80109) and D (♀ 77111 × ♂ 2388). Genetic distances are indicated in cM (Kosambi) at the left of each linkage group. QTLs for bud flush, bud set and height growth are indicated by green, blue, and orange circles and bars, respectively. Thin and large vertical bars of each QTL correspond respectively to -1LOD and -2LOD confidence intervals and are positioned compared to marker position on central bar of each linkage group. Circles identify gene markers associated to each -1LOD confidence interval of each QTL. Note that because of the dense positioning of markers, physical position of circles and confidence intervals can not be plotted beside each other. QTL names correspond to environmental condition (indoor = AAFC or outdoor = VES), year and for bud flush and bud set, principal component identifying each QTL, i.e. PC1, PC2 or PC3 (Table 2). An asterisk was added for QTLs identified from total height growth in order to distinguish them to QTLs identified for annual height growth in 2006 for the cross D. Red stars indicate the correspondence between QTL-marker and outlier candidate gene SNPs involved in local adaption for white spruce [108].

References

    1. Rohde A, Storme V, Jorge V, Gaudet M, Vitacolonna N, Fabbrini F, Ruttink T, Zaina G, Marron N, Dillen S. et al. Bud set in poplar--genetic dissection of a complex trait in natural and hybrid populations. New Phytologist. 2011;189(1):106–121. doi: 10.1111/j.1469-8137.2010.03469.x. - DOI - PubMed
    1. Frewen BE, Chen TH, Howe GT, Davis J, Rohde A, Boerjan W, Bradshaw HD Jr. Quantitative trait loci and candidate gene mapping of bud set and bud flush in populus. Genetics. 2000;154(2):837–845. - PMC - PubMed
    1. Grattapaglia D, Plomion C, Kirst M, Sederoff RR. Genomics of growth traits in forest trees. Current Opinion in Plant Biology. 2009;12(2):148–156. doi: 10.1016/j.pbi.2008.12.008. - DOI - PubMed
    1. Gailing O, Vornam B, Leinemann L, Finkeldey R. Genetic and genomic approaches to assess adaptive genetic variation in plants: forest trees as a model. Physiologia Plantarum. 2009;137(4):509–519. doi: 10.1111/j.1399-3054.2009.01263.x. - DOI - PubMed
    1. Cardon LR, Bell JI. Association study designs for complex diseases. Nature Reviews Genetics. 2001;2(2):91–99. doi: 10.1038/35052543. - DOI - PubMed

Publication types

LinkOut - more resources