. 2011 Mar;17(3):350-6.
doi: 10.3201/eid1703.100882.

Q fever in France, 1985-2009

Affiliations

Q fever in France, 1985-2009

Diane Frankel et al. Emerg Infect Dis. 2011 Mar.

Abstract

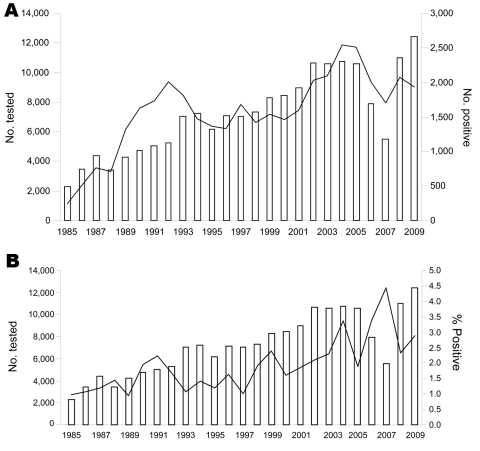
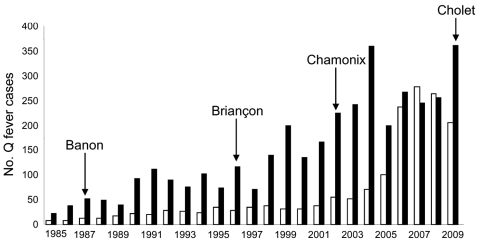
To assess Q fever in France, we analyzed data for 1985-2009 from the French National Reference Center. A total of 179,794 serum samples were analyzed; 3,723 patients (one third female patients) had acute Q fever. Yearly distribution of acute Q fever showed a continuous increase. Periodic variations were observed in monthly distribution during January 2000-December 2009; cases peaked during April-September. Q fever was diagnosed more often in patients in southeastern France, where our laboratory is situated, than in other areas. Reevaluation of the current positive predictive value of serologic analysis for endocarditis was performed. We propose a change in the phase I (virulent bacteria) immunoglobulin G cutoff titer to ≥1,600. Annual incidences of acute Q fever and endocarditis were 2.5/100,000 persons and 0.1/100,000 persons, respectively. Cases and outbreaks of Q fever have increased in France.


Figures

Figure 1
Figure 1
Serum samples tested for Q fever, France, 1985–2009. A) Black line indicates no. positive. B) Black line indicates % positive for acute Q fever.
Figure 2
Figure 2
Cases of chronic (white bars) and acute (black bars) Q fever, France, 1985–2009. Locations where outbreaks were reported are indicated by arrows.
Figure 3
Figure 3
Seasonality of acute Q fever cases, France, 2000–2009.
Figure 4
Figure 4
Geographic distribution of acute Q fever cases, France, 2000–2009. Values and scale bar indicate % prevalence.

References

    1. Maurin M, Raoult D. Q fever. Clin Microbiol Rev. 1999;12:518–53. - PMC - PubMed
    1. Raoult D. Reemergence of Q fever after 11 September 2001. Clin Infect Dis. 2009;48:558–9. 10.1086/596706 - DOI - PubMed
    1. Raoult D, Tissot-Dupont H, Foucault C, Gouvernet J, Fournier PE, Bernit E, et al. Q fever 1985–1998. Clinical and epidemiologic features of 1,383 infections. Medicine (Baltimore). 2000;79:109–23. 10.1097/00005792-200003000-00005 - DOI - PubMed
    1. Enserink M. Infectious diseases. Questions abound in Q-fever explosion in the Netherlands. Science. 2010;327:266–7. 10.1126/science.327.5963.266-a - DOI - PubMed
    1. Amitai Z, Bromberg M, Bernstein M, Raveh D, Keysary A, David D, et al. A large Q fever outbreak in an urban school in central Israel. Clin Infect Dis. 2010;50:1433–8. 10.1086/652442 - DOI - PubMed

LinkOut - more resources