. 2011 May 13;286(19):17144-55.
doi: 10.1074/jbc.M110.210526. Epub 2011 Mar 10.

Neutralizing interleukin-1beta (IL-1beta) induces beta-cell survival by maintaining PDX1 protein nuclear localization

Affiliations

Neutralizing interleukin-1beta (IL-1beta) induces beta-cell survival by maintaining PDX1 protein nuclear localization

Amin Ardestani et al. J Biol Chem. .

Retraction in

Abstract

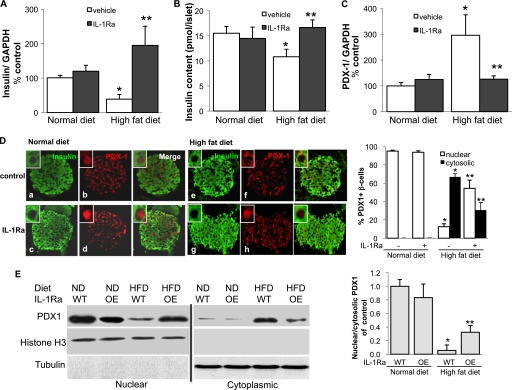
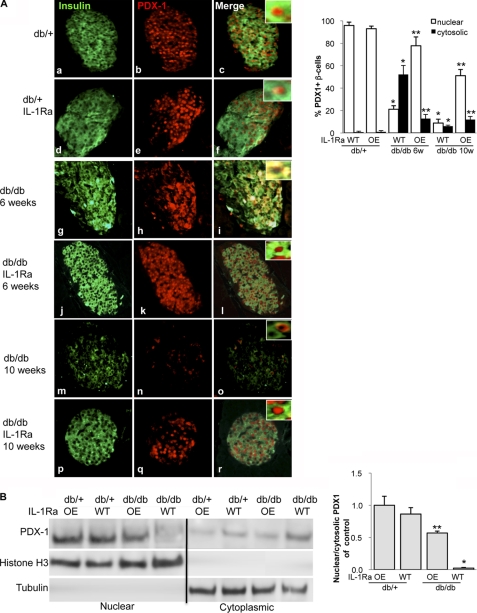
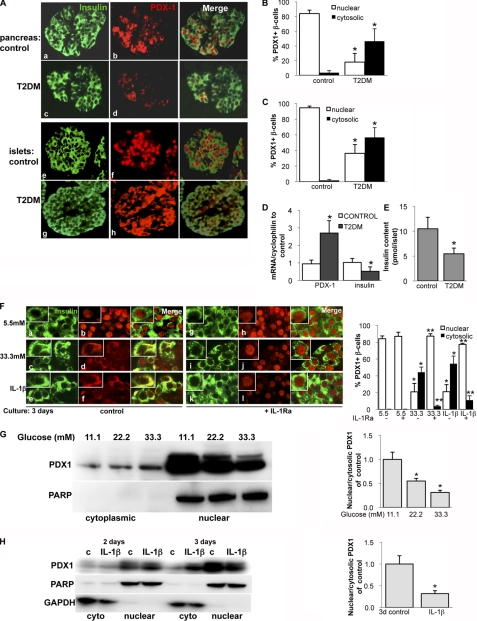
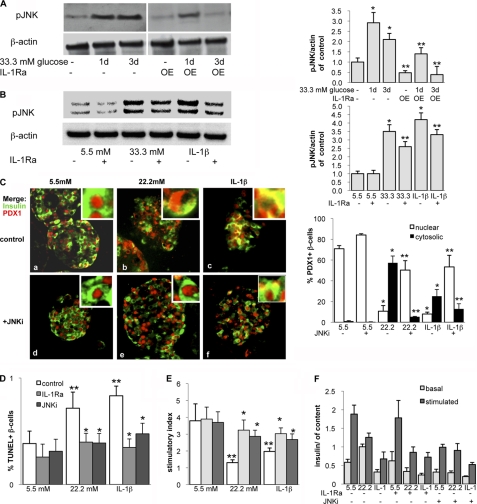
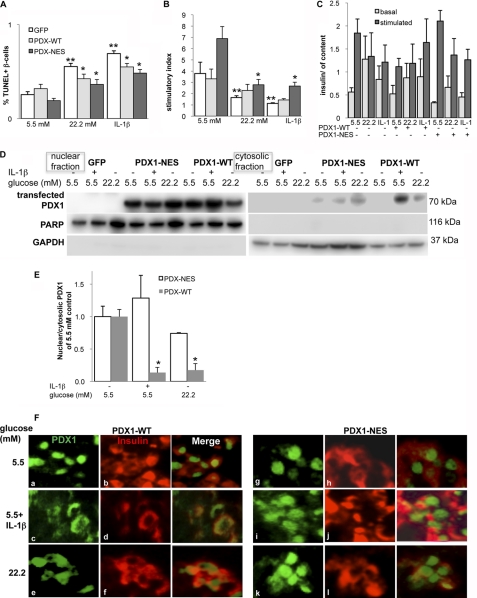
The transcription factor PDX1 plays a critical role during β-cell development and in glucose-induced insulin gene transcription in adult β-cells. Acute glucose exposure leads to translocalization of PDX1 to the nucleoplasm, whereas under conditions of oxidative stress, PDX1 shuttles from the nucleus to the cytosol. Here we show that cytosolic PDX1 expression correlated with β-cell failure in diabetes. In isolated islets from patients with type 2 diabetes and from diabetic mice, we found opposite regulation of insulin and PDX1 mRNA; insulin was decreased in diabetes, but PDX1 was increased. This suggests that elevated PDX1 mRNA levels may be insufficient to regulate insulin. In diabetic islets, PDX1 protein was localized in the cytosol, whereas in non-diabetic controls, PDX1 was in the nucleus. In contrast, overexpression of either IL-1 receptor antagonist or shuttling-deficient PDX1 restored β-cell survival and function and PDX1 nuclear localization. Our results show that nuclear localization of PDX1 is essential for a functional β-cell and provides a novel mechanism of the protective effect of IL-1 receptor antagonist on β-cell survival and function.


Figures

FIGURE 1.
FIGURE 1.
High fat diet induces PDX1 translocalization to the cytosol. C57Bl/6J mice treated daily with vehicle or 10 mg/kg IL-1Ra were fed a diet enriched with fat and sucrose (HFD) or a normal chow diet (ND) for 12 weeks. A–C, RT-PCR analysis of insulin (A) and PDX1 (C) expression relative to control normal diet conditions and insulin content (B) of mouse islets isolated from the four treatment groups. In the LightCycler System, mRNA levels were normalized to GAPDH and tubulin with the same result. Islets were isolated from four mice per treatment group. D, double immunostaining for insulin (green; a, c, e, and g) and PDX1 (red; b, d, f, and h) in mouse pancreatic tissue sections from all four treatment groups; staining was performed on four different pancreases per treatment group (magnification, ×250; inset magnification, ×2000). The percentage of nuclear and cytosolic PDX1 was calculated by counting 2000 insulin-positive β-cells from four mice in each condition. E, Western blot analysis of PDX1 from nuclear and cytosolic fractions from isolated islets from C57Bl/6J WT- or IL-1Ra-overexpressing mice fed an ND or HFD for 12 weeks. Histone H3 and tubulin were used as loading controls, and purity of fractions for the nuclear and cytosolic extracts from the same protein lysates was assessed. One representative blot of three experiments is shown. Densitometry analysis of bands normalized to histone H3 or tubulin shows the ratio of nuclear and cytosolic PDX1 expression. Data are shown as mean ± S.E. *, p < 0.05 HFD compared to ND WT mice, **, p < 0.05 IL-1Ra treated HFD compared to nontreated HFD mice.
FIGURE 2.
FIGURE 2.
PDX1 translocalization to the cytosol in db/db mice is prevented by IL-1Ra overexpression. A, insulin staining in green (a, d, g, j, m, and p) and PDX1 in red (b, e, h, k, n, and q) of control heterozygous db/+ (a–c) and db/+IL-1Ra (d–f) mice and db/db (g–i and m–o) and db/dbIL-1Ra (j–l and p–r) littermates at the age of 6 (g–l) and 10 weeks (m–r). Staining was performed on three different pancreases per treatment group from three independent experiments, respectively (magnification, ×250; inset magnification, ×2000). Percentage of nuclear and cytosolic PDX1 was calculated by counting 2000 insulin-positive β-cells from three mice in each condition. B, Western blot analysis of islet lysates from 6-week-old heterozygous db/+, db/+IL-1Ra, db/db, and db/dbIL-1Ra mice. Histone H3 and tubulin were used as loading controls, and purity of fractions in the same membrane after stripping was assessed. One representative blot of three experiments is shown. Densitometry analysis of bands normalized to histone H3 or tubulin shows the ratio of nuclear and cytosolic PDX1 expression. Data are shown as mean ± S.E. *, p < 0.05 db/db compared to db/+, **, p < 0.05 OE-db/db compared to db/db.
FIGURE 3.
FIGURE 3.
PDX1 is localized in the cytosol in T2DM. A, representative double immunostaining for insulin (green; a, c, e, and g) and PDX1 (red; b, d, f, and h) performed in human pancreatic (a–d) and human isolated islet (e–h) sections from seven (c and d) or three (g and h) poorly controlled patients with T2DM and seven (a and b) or three (e and f) healthy controls (magnification, ×250; inset magnification, ×2000). The percentage of nuclear and cytosolic PDX1 was calculated by counting 2000 insulin-positive β-cells from seven pancreatic sections (B) and three islet sections (C) in each condition. D, quantitative RT-PCR analysis of insulin and PDX1 expression from mRNA; E, insulin content from HCl-ethanol extracts from human islets isolated from control patients and patients with T2DM. In the LightCycler system, mRNA levels was normalized to cyclophilin and tubulin with the same result. Data are shown as mean ± S.E. (error bars) from six (mRNA) or three (content) islet isolations from six (three) control patients and six (three) patients with T2DM. *, p < 0.05 T2DM compared with controls. F, human isolated islets were treated for 72 h with 5.5 mm glucose (control), 33.3 mm glucose, or 2 ng/ml IL-1β with or without 500 ng/ml recombinant human IL-1Ra. Fixed and paraffin-embedded islets sections were double-stained for insulin (green; a, c, e, g, i, and k) and PDX1 (red; b, d, f, h, j, and l) and analyzed under the confocal microscope. (magnification, ×1000; inset magnification, ×4000). Islets were isolated from three different donors, and 3 independent experiments were performed. The percentage of nuclear and cytosolic PDX1 was calculated by counting 2000 insulin-positive β-cells from three experiments in each condition. G and H, Western blot analysis of PDX1 of glucose-treated (3 days; 11.1–33.3; G) and IL-1β-treated (2–3 days; 2 ng/ml; H) nuclear and cytosolic cell lysates of the β-cell line INS-1E. GAPDH was used as loading control, and purity of fractions for the cytosolic extracts and full-length PARP for the nuclear extracts in the same membrane after stripping was assessed. One representative blot of three experiments is shown. Densitometry analysis of bands normalized to PARP or GAPDH shows the ratio of nuclear and cytosolic PDX1 expression. Because there were no changes, the 2-day results were not analyzed in H.
FIGURE 4.
FIGURE 4.
IL-1Ra prevents prolonged glucose- and IL-1β-induced JNK-activation. A, isolated islets from mice overexpressing IL-1Ra (IL-1Ra-OE) and wild type littermates were treated for 24–72 h with 11.1 mm glucose (control) or 33.3 mm glucose. Shown is immunoblotting for phosphorylated JNK and β-actin (loading control). The antibodies were blotted on the same membrane. One representative experiment of three is shown. Shown is densitometry analysis of phospho-JNK bands normalized to β-actin. B–D, isolated human islets were cultured in suspension for 24–72 h in 5.5 mm glucose (control), 22.2 or 33.3 mm glucose, or 2 ng/ml IL-1β with or without the addition of 500 ng/ml recombinant human IL-1Ra (B) or 10 μm JNKi (C). B, immunoblotting of phosphorylated JNK and β-actin (loading control). The antibodies were blotted on the same membrane. One representative blot of three experiments from three donors is shown. Shown is densitometry analysis of phospho-JNK bands normalized to β-actin. C, after 72 h of treatment, fixed and paraffin-embedded islet sections were double-stained for insulin in green and PDX1 in red and analyzed under the microscope (magnification, ×250; inset magnification, ×2000). Islets were isolated from three different donors, and 3 independent experiments were performed. D and E, for the analysis of β-cell survival and glucose-stimulated insulin secretion, islets were cultured on extracellular matrix-coated dishes and treated for 72 h. D, β-cell apoptosis expressed as a percentage of TUNEL-positive β-cells ± S.E. The mean number of β-cells scored was 2945 ± 218 for each treatment condition in three independent experiments from three different donors. E and F, glucose-stimulated insulin secretion of islets. Stimulatory index (E) denotes the ratio between stimulated (16.7 mm glucose) and basal (2.8 mm glucose) values normalized to insulin content (F) of insulin secretion during successive 1-h incubations. Results are means ± S.E. (error bars) from three independent experiments from three donors. *, p < 0.05 compared with control at 5.5 mm glucose. **, p < 0.05, IL-1Ra- or JNKi-treated islets compared with untreated islets under the same conditions.
FIGURE 5.
FIGURE 5.
Mutation of the PDX1 nuclear export signal restores β-cell survival and function. Human isolated islets were cultured on extracellular matrix-coated dishes and transfected with a GFP control plasmid, with WT PDX1, or with an NES mutant PDX1 (PDX1-NES), in which the NES-like sequence was disrupted. 24 h after transfection, islets were exposed to elevated glucose or IL-1β for 72 h. A, β-cell apoptosis expressed as a percentage of TUNEL-positive β-cells ± S.E. The mean number of β-cells scored was 1545 ± 112 for each treatment condition in three independent experiments from three different donors. B and C, glucose-stimulated insulin secretion of islets. Stimulatory index (B) denotes the ratio between stimulated (16.7 mm glucose) and basal (2.8 mm glucose) values normalized to insulin content (C) of insulin secretion during successive 1-h incubations. Results are means ± S.E. from three independent experiments from three donors. **, p < 0.05 compared with control at 5.5 mm glucose. *, p < 0.05, PDX1-WT- or PDX1-NES-treated islets compared with untreated islets under the same conditions. D, Western blot analysis for transfected PDX1 fused to GFP was performed with nuclear and cytosolic fractions of islet lysates. PARP and GAPDH were used as loading control for nuclear (left) and cytosolic (right) extracts. One representative blot of three experiments is shown. E, densitometry analysis of bands normalized to PARP or GAPDH shows the ratio of nuclear and cytosolic transfected PDX1 expression. *, p < 0.05 compared with control at 5.5 mm glucose. Islets were isolated from three different donors, and 3 independent experiments were performed. F, fixed and paraffin-embedded islet sections were double-stained for PDX1 (green; a, c, and e and g, i, and k) and insulin (red; b, d, and f and h, j, and l) and analyzed under the fluorescent microscope (magnification, ×800).

References

    1. Donath M. Y., Schumann D. M., Faulenbach M., Ellingsgaard H., Perren A., Ehses J. A. (2008) Diabetes Care 31, Suppl. 2, S161–S164 - PubMed
    1. Ehses J. A., Böni-Schnetzler M., Faulenbach M., Donath M. Y. (2008) Biochem. Soc. Trans. 36, 340–342 - PubMed
    1. Heitmeier M. R., Arnush M., Scarim A. L., Corbett J. A. (2001) J. Biol. Chem. 276, 11151–11158 - PubMed
    1. Maedler K., Sergeev P., Ris F., Oberholzer J., Joller-Jemelka H. I., Spinas G. A., Kaiser N., Halban P. A., Donath M. Y. (2002) J. Clin. Invest. 110, 851–860 - PMC - PubMed
    1. Böni-Schnetzler M., Thorne J., Parnaud G., Marselli L., Ehses J. A., Kerr-Conte J., Pattou F., Halban P. A., Weir G. C., Donath M. Y. (2008) J. Clin. Endocrinol. Metab. 93, 4065–4074 - PMC - PubMed

Publication types

LinkOut - more resources