. 2011 May 6;286(18):16332-43.
doi: 10.1074/jbc.M110.216986. Epub 2011 Mar 10.

Interorgan coordination of the murine adaptive response to fasting

Affiliations

Interorgan coordination of the murine adaptive response to fasting

Theodorus B M Hakvoort et al. J Biol Chem. .

Abstract

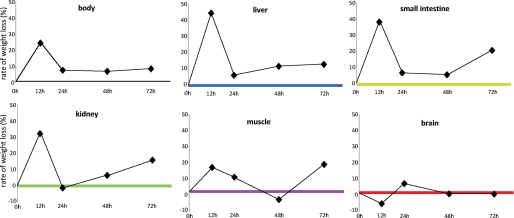
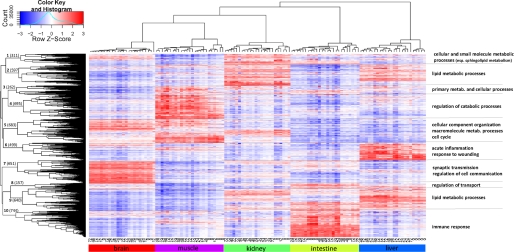
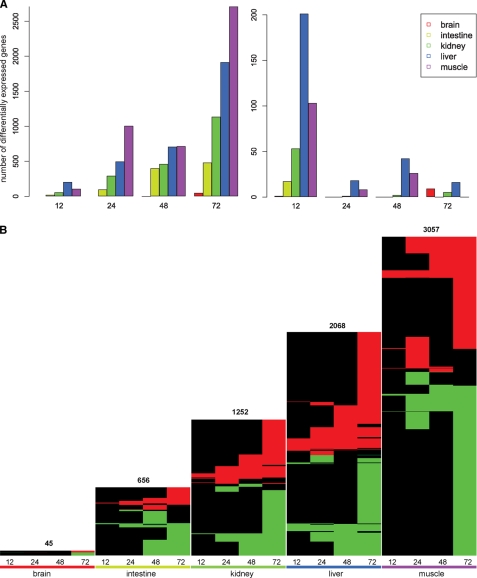
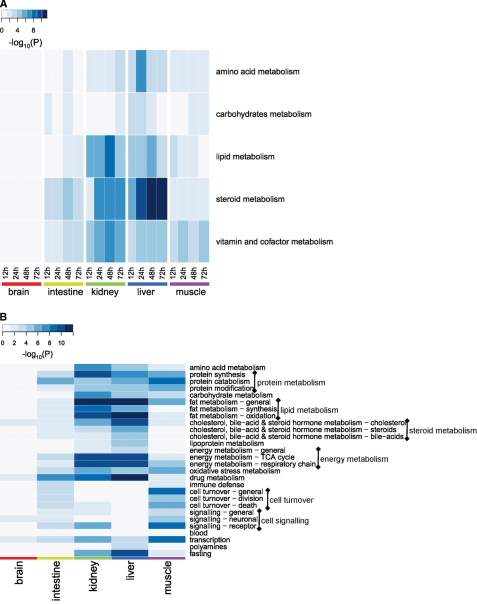
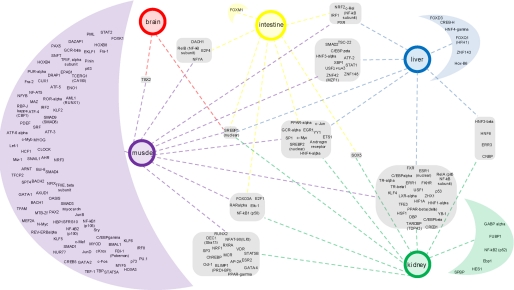
Starvation elicits a complex adaptive response in an organism. No information on transcriptional regulation of metabolic adaptations is available. We, therefore, studied the gene expression profiles of brain, small intestine, kidney, liver, and skeletal muscle in mice that were subjected to 0-72 h of fasting. Functional-category enrichment, text mining, and network analyses were employed to scrutinize the overall adaptation, aiming to identify responsive pathways, processes, and networks, and their regulation. The observed transcriptomics response did not follow the accepted "carbohydrate-lipid-protein" succession of expenditure of energy substrates. Instead, these processes were activated simultaneously in different organs during the entire period. The most prominent changes occurred in lipid and steroid metabolism, especially in the liver and kidney. They were accompanied by suppression of the immune response and cell turnover, particularly in the small intestine, and by increased proteolysis in the muscle. The brain was extremely well protected from the sequels of starvation. 60% of the identified overconnected transcription factors were organ-specific, 6% were common for 4 organs, with nuclear receptors as protagonists, accounting for almost 40% of all transcriptional regulators during fasting. The common transcription factors were PPARα, HNF4α, GCRα, AR (androgen receptor), SREBP1 and -2, FOXOs, EGR1, c-JUN, c-MYC, SP1, YY1, and ETS1. Our data strongly suggest that the control of metabolism in four metabolically active organs is exerted by transcription factors that are activated by nutrient signals and serves, at least partly, to prevent irreversible brain damage.


Figures

FIGURE 1.
FIGURE 1.
Rate of weight loss of body and organs during fasting. The rate of weight loss is calculated in comparison to the previous fasting time point and expressed as percent change in weight per day. Whole-body weight loss and that of the three visceral organs was significant (p < 10−3) at all the time points compared with that in non-fasted mice. Muscle weight loss became significant only after 72 h (p < 0.004), whereas no significant weight loss was seen in the brain.
FIGURE 2.
FIGURE 2.
Unsupervised hierarchical clustering of normalized microarray data. Clustering of 122 microarrays that passed quality control was performed using complete linkage and Pearson correlation distance on the 5237 genes that were differentially expressed in any of the tissues. The Z-score is calculated on the rows by subtracting the mean expression value of the row from each of the values and then dividing the resulting values by the standard deviation of the row. Color in the heat maps, therefore, indicates the relative gene expression level, with red being higher and blue lower than the mean expression value. Number of genes belonging to the 10 clusters is given on the corresponding branches of the dendrogram. Major Gene Ontology processes overrepresented in those clusters are summarized on the right.
FIGURE 3.
FIGURE 3.
Number of differentially expressed genes per time point of fasting. Panel A, shown is number of genes that are differentially expressed (corrected p < 0.05) in comparison with 0h fasting (left panel) and in comparison with the previous time point of fasting (12 versus 0, 24 versus 12 etc.; right panel). Fasting generated a progressive adaptive response, but the most pronounced changes occurred during the first 12 h. Panel B, shown are heat maps containing all differentially expressed genes in five organs at four fasting conditions. In each heat map a row represents a single gene, with red depicting significant up-regulation, and green depicting significant down-regulation. Black indicates no differential expression at that time point. Genes with similar behavior across time (within an organ) are clustered together using complete linkage and Euclidean distance. The height of heat maps is scaled to (indirectly) reflect the number of genes.
FIGURE 4.
FIGURE 4.
Interorgan similarities and differences in metabolic processes affected by fasting. Panel A, shown is spatiotemporal distribution of significantly regulated processes (as defined in the MetaCoreTM suit) after functional-category enrichment analysis. The heat map visualizes significantly regulated processes (y axis) in each of the organs at different time points of fasting (x axis). Panel B, higher order keywords enriched by fasting as produced by CoPub keyword-enrichment analysis are shown. The heat map shows the level of significance of 28 higher order categories keywords for each of the organs for the whole duration of fasting. Color intensity depicts the significance of the change expressed as the negative logarithm of p values obtained in both analyses. TCA, tricarboxylic acid cycle.
FIGURE 5.
FIGURE 5.
Common and organ-specific transcriptional regulators of the fasting response. Overconnectivity of transcription factors (the nodes of the primary networks of differentially regulated genes) was calculated for each organ using MetaCore Interactome analysis. The resulting network of common and organ-specific regulators was created and visualized in Cytoscape and enhanced in Adobe Illustrator. The tissues are represented with colored circles. Transcription factors, grouped according to the organs for which they are common or specific, are depicted in corresponding rounded squares/half-moons, respectively.

References

    1. Diamond J. (2003) Nature 423, 599–602 - PubMed
    1. Södersten P., Bergh C., Zandian M. (2006) Horm. Behav. 50, 572–578 - PubMed
    1. Cahill G. F., Jr. (2006) Annu. Rev. Nutr. 26, 1–22 - PubMed
    1. Owen O. E., Felig P., Morgan A. P., Wahren J., Cahill G. F., Jr. (1969) J. Clin. Invest. 48, 574–583 - PMC - PubMed
    1. Felig P., Owen O. E., Wahren J., Cahill G. F., Jr. (1969) J. Clin. Invest. 48, 584–594 - PMC - PubMed

Publication types

Associated data