. 2011 Mar 29;108(13):5348-53.
doi: 10.1073/pnas.1014277108. Epub 2011 Mar 10.

Determinism and stochasticity during maturation of the zebrafish antibody repertoire

Affiliations

Determinism and stochasticity during maturation of the zebrafish antibody repertoire

Ning Jiang et al. Proc Natl Acad Sci U S A. .

Abstract

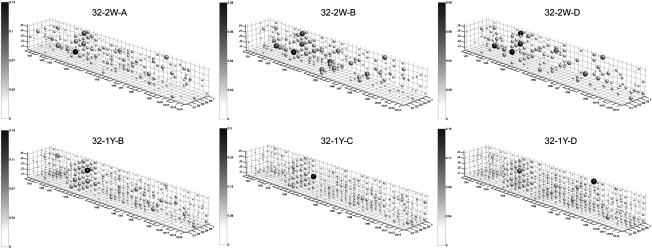
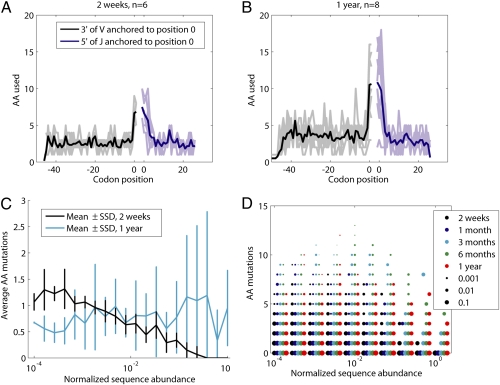
It is thought that the adaptive immune system of immature organisms follows a more deterministic program of antibody creation than is found in adults. We used high-throughput sequencing to characterize the diversifying antibody repertoire in zebrafish over five developmental time points. We found that the immune system begins in a highly stereotyped state with preferential use of a small number of V (variable) D (diverse) J (joining) gene segment combinations, but that this stereotypy decreases dramatically as the zebrafish mature, with many of the top VDJ combinations observed in 2-wk-old zebrafish virtually disappearing by 1 mo. However, we discovered that, in the primary repertoire, there are strong correlations in VDJ use that increase with zebrafish maturity, suggesting that VDJ recombination involves a level of deterministic programming that is unexpected. This stereotypy is masked by the complex diversification processes of antibody maturation; the variation and lack of correlation in full repertoires between individuals appears to be derived from randomness in clonal expansion during the affinity maturation process. These data provide a window into the mechanisms of VDJ recombination and diversity creation and allow us to better understand how the adaptive immune system achieves diversity.


Conflict of interest statement

Conflict of interest statement: A patent disclosure was filed by Stanford University.

Figures

Fig. 1.
Fig. 1.
3D representations of VDJ repertoires for subsamples of 2-wk-old (Top three panels) and 1-y-old (Bottom three panels) samples from a single family. [Sample name is ordered: family-age-(letter ID)]. Dot size scales logarithmically with bias-normalized abundance, whereas coloring scales linearly. Color bars indicate fraction of total abundance. Stereotypy in abundance among a large number of VDJ combinations is found to disappear. More generally, although at an early age multiple VDJ combinations are found to share high abundances, later ages display great abundance disparity, with a far smaller number of VDJ combinations holding a greater amount of abundance.
Fig. 2.
Fig. 2.
Characteristics of the VDJ use. (A) Time course of VDJ use for IgM heavy chains at a fixed sequencing depth of 32,000 reads among the 975 possible IgM VDJ combinations. Black line represents bounds by the most- and least-represented fish in that age group; solid blue line represents median value within that age group; and dotted blue line represents sample SD away from that value. (B) Top 10 VDJ (ranked by bias-normalized abundance) from fish subsampled to 32,000 reads at 2 wk and 1 mo of age. Individual fish are represented by columns. Differently colored shapes represent VDJ combinations that occur more than once in the diagram (the same symbol occurring anywhere in the two subplots represents the same VDJ combination); black dots represent VDJ combinations that occur only in one individual's top 10 VDJs. (C) Top 5 VDJ combinations (ranked by read number) at 2 wk tracked over subsequent ages. Data from fish that are sampled to a depth of 32,000 reads are listed. (D) Average and sample SD of time course correlating the VDJ repertoires of pairs of individuals for different age groups. VDJ abundances (red) are bias normalized. Correlations of the square roots of VDJ bias-normalized abundances (green) reduce the impact of the most abundant VDJ combination. To the same end, correlations of VDJ presence (cyan) are performed by assigning each VDJ combination a 1 or 0 depending on its being observed.
Fig. 3.
Fig. 3.
Characteristics of primary repertoire. (A) Scatter plot of number of lineages and number of reads observed across the 2-wk and 1-mo age groups (a small offset along the y axis allows both sets of data points to be seen), revealing more lineages in mature fish. (B) Average and sample SDs of correlations between different members of the same age-group with VDJ repertoires weighted by raw reads (red), without bias-normalization, and lineages (green). For each individual, read-weighted and lineage-weighted VDJ repertoires are further correlated (black). Color maps of read-weighted (C) and lineage-weighted (D) VDJ correlations between fish sampled to 40,000 read depths. Age groups are delineated as 2 wk (2W), 1 mo (1M), 3 mo (3M), 6 mo (6M), and 1 y (1Y).
Fig. 4.
Fig. 4.
Characteristics of the secondary repertoire. Amino acid diversification at 2 wk (A) and 1 y (B) for the most abundant VJ combination in each fish, the combination itself subsampled, to 5,000 reads. Amino acids are counted at a particular position if they occur at least once in the data set. Observed d-gene segment diversity across these two datasets averages 3.8 and 4.0, respectively. The 3-prime end of V gene segments (black) and the 5-prime end of J gene segments (blue) are anchored to position zero. Dark colors denote the average over the amino acid use of individual fish (drawn in light colors). (C) Average amino acid mutations as a function of sequence abundance at 2-wk and 1-y time points, using lineage analysis. Mutation is defined as the amino acid differences between one sequence and the sequence within the same lineage that most closely resembles the reference genomic sequences. Sequencing depth is fixed at 40,000 reads. Abundances are both bias normalized and divided by the most abundant sequence in the repertoire. Twenty log-spaced bins are spaced evenly between 0.0001 and 1. (D) Using the 10 bins in the same interval, the distribution of amino acid mutations is plotted with dot sizes that scale as the fraction of the total unique sequences at a particular abundance across all fish in the color-coded age group.

References

    1. Stein KE. Thymus-independent and thymus-dependent responses to polysaccharide antigens. J Infect Dis. 1992;165(Suppl 1):S49–S52. - PubMed
    1. Bekker A, Chou C, Bernstein HH. Update on universal annual influenza immunization recommendations for children. Curr Opin Pediatr. 2009;21:122–126. - PubMed
    1. Schroeder HW., Jr Similarity and divergence in the development and expression of the mouse and human antibody repertoires. Dev Comp Immunol. 2006;30:119–135. - PubMed
    1. Yancopoulos GD, et al. Preferential utilization of the most JH-proximal VH gene segments in pre-B-cell lines. Nature. 1984;311:727–733. - PubMed
    1. Perlmutter RM, Kearney JF, Chang SP, Hood LE. Developmentally controlled expression of immunoglobulin VH genes. Science. 1985;227:1597–1601. - PubMed

Publication types

LinkOut - more resources