. 2011 Mar;121(3):1064-74.
doi: 10.1172/JCI44540.

CD44 splice isoform switching in human and mouse epithelium is essential for epithelial-mesenchymal transition and breast cancer progression

Affiliations

CD44 splice isoform switching in human and mouse epithelium is essential for epithelial-mesenchymal transition and breast cancer progression

Rhonda L Brown et al. J Clin Invest. 2011 Mar.

Abstract

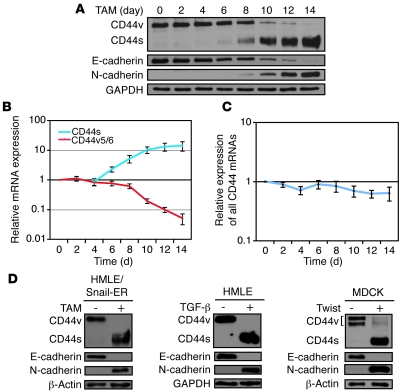
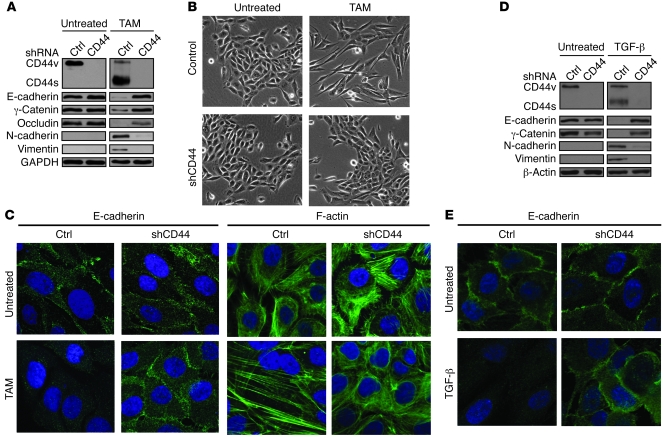
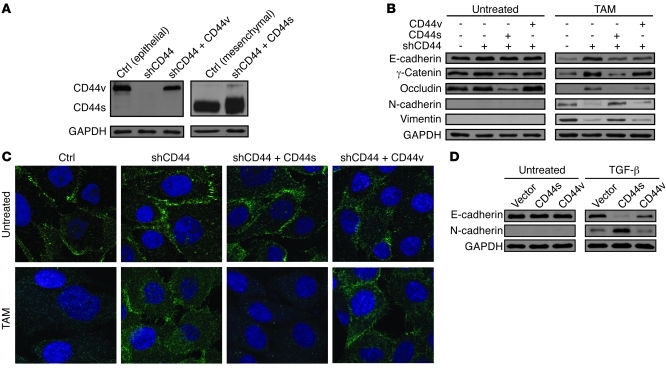
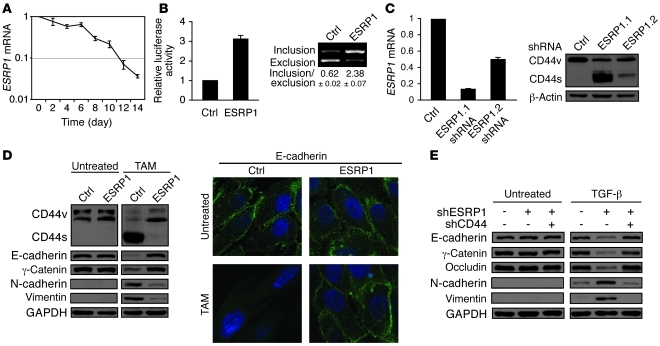
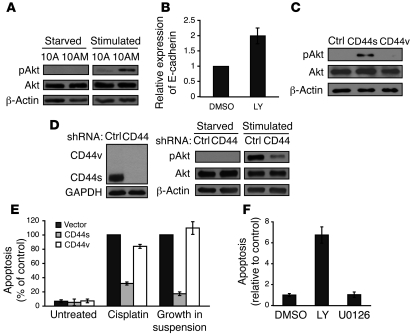
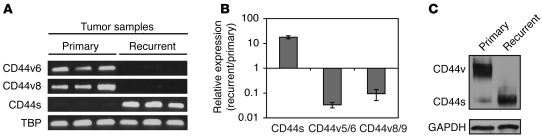
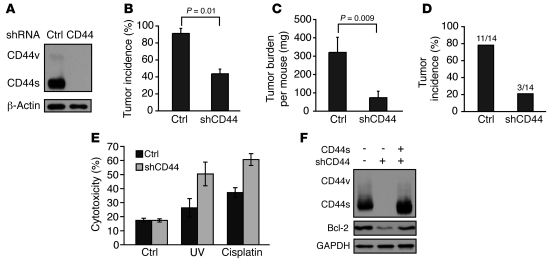
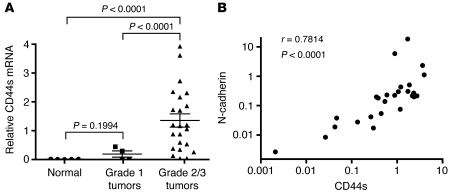
Epithelial-mesenchymal transition (EMT) is a tightly regulated process that is critical for embryogenesis but is abnormally activated during cancer metastasis and recurrence. Here we show that a switch in CD44 alternative splicing is required for EMT. Using both in vitro and in vivo systems, we have demonstrated a shift in CD44 expression from variant isoforms (CD44v) to the standard isoform (CD44s) during EMT. This isoform switch to CD44s was essential for cells to undergo EMT and was required for the formation of breast tumors that display EMT characteristics in mice. Mechanistically, the splicing factor epithelial splicing regulatory protein 1 (ESRP1) controlled the CD44 isoform switch and was critical for regulating the EMT phenotype. Additionally, the CD44s isoform activated Akt signaling, providing a mechanistic link to a key pathway that drives EMT. Finally, CD44s expression was upregulated in high-grade human breast tumors and was correlated with the level of the mesenchymal marker N-cadherin in these tumors. Together, our data suggest that regulation of CD44 alternative splicing causally contributes to EMT and breast cancer progression.


Figures

Figure 1
Figure 1. Switch in CD44 isoform expression during EMT.
(A) Immunoblot analysis of CD44 isoforms during tamoxifen-induced (TAM-induced) EMT in HMLE cells expressing Twist-ER (HMLE/Twist-ER). The CD44 antibody recognizes CD44v and CD44s isoforms, although with conceivably higher affinity for CD44s. Immunoblots of EMT markers E-cadherin and N-cadherin confirm that these cells undergo EMT. (B) qRT-PCR analysis of levels of CD44 isoforms using primers that specifically detect either CD44s or CD44v containing variable exons v5 and v6 (v5/6). Relative expression levels of CD44s or CD44v5/6 in TAM-treated cells were normalized to untreated cells at each time point, and the results are shown relative to day 0. Error bars indicate SD; n = 4. (C) Relative mRNA levels of all CD44 isoforms in TAM-treated cells were normalized to untreated cells at each time point, and results are shown relative to day 0. Error bars indicate SD; n = 4. (D) Immunoblot analysis of CD44 isoforms during EMT induced by tamoxifen-mediated Snail-ER translocation to the nucleus in HMLE/Snail-ER cells (left), TGF-β (5 ng/ml) treatment in HMLE cells (middle), or Twist expression in MDCK cells (right). Immunoblots of EMT markers E-cadherin and N-cadherin confirm that these cells undergo EMT.
Figure 2
Figure 2. Depletion of CD44 inhibits EMT.
(A) Immunoblot analysis of EMT markers in HMLE/Twist-ER cells expressing luciferase (control) or CD44 shRNA targeting all CD44 isoforms before (untreated) and after 14 days of tamoxifen treatment. Upon TAM treatment, CD44 shRNA–expressing cells show impaired downregulation of epithelial markers and upregulation of mesenchymal markers. (B) Phase contrast images (×10) illustrating impaired morphological changes in cells expressing CD44 shRNA (shCD44) after 14 days of TAM treatment compared with control cells. (C) Immunofluorescence images (original magnification, ×63) indicating that, unlike control cells, shCD44 cells maintain E-cadherin localization at cell junctions and do not undergo cytoskeletal reorganization after 12 days of TAM treatment. Green staining indicates E-cadherin or F-actin (left or right panels, respectively). DAPI staining (blue) indicates nuclei. (D) Immunoblot analysis of EMT markers in HMLE cells expressing control luciferase shRNA (Ctrl) or CD44 shRNA before (untreated) and after 18 days of 5 ng/ml TGF-β treatment. Upon TGF-β treatment, CD44 shRNA–expressing cells show impaired downregulation of epithelial markers and upregulation of mesenchymal markers. (E) Immunofluorescence images (original magnification, ×60) demonstrating that E-cadherin localization is preserved at cell junctions in CD44 shRNA–expressing cells after 18 days of TGF-β treatment. Green staining indicates E-cadherin, and blue staining indicates nuclei.
Figure 3
Figure 3. The specific CD44s isoform is essential for EMT.
(A) Immunoblot analysis of CD44 in HMLE/Twist-ER cells expressing CD44 shRNA (shCD44) and reconstituted with CD44s or CD44v. (B) Immunoblot analysis of EMT markers in cells reconstituted with CD44s or CD44v before (untreated) and after 12 days of TAM treatment, indicating that reconstituting CD44s, but not CD44v, rescues the impaired EMT phenotype in shCD44 cells. (C) Immunofluorescence images (original magnification, ×63) of cells expressing control, shCD44, or shCD44 reconstituted with CD44s or CD44v, before and after 12 days of TAM treatment. Green staining indicates E-cadherin. DAPI staining (blue) indicates nuclei. (D) Immunoblot analysis of EMT markers in MCF10A cells expressing CD44s or CD44v before (untreated) and after 20 days of TGF-β (1 ng/ml) treatment, indicating that CD44s expression accelerates TGF-β–induced EMT.
Figure 4
Figure 4. The splicing factor ESRP1 regulates CD44 isoform switching during EMT.
(A) qRT-PCR analysis of ESRP1 levels in HMLE/Twist-ER cells during TAM-induced EMT. (B) Relative luciferase activity (left) and semiquantitative RT-PCR analysis (right) in 293 cells cotransfected with ESRP1 and a CD44v5 luciferase reporter construct, indicating that ESRP1 promotes inclusion of CD44 variable exons. (C) Left: qRT-PCR analysis showing knockdown efficiency of ESRP1 in HMLE cells using two different shRNAs. Right: Immunoblot analysis showing decreased expression of CD44v and increased expression of CD44s in HMLE cells in which ESRP1 has been silenced. (D) Immunoblot analysis of CD44 and EMT markers in control and ESRP1-overexpressing HMLE/Twist-ER cells before (untreated) and after 14 days of TAM treatment (left), demonstrating that ESRP1 overexpression inhibits both the CD44 isoform switch and EMT. Immunofluorescence imaging (right) shows that overexpression of ESRP1 results in maintenance of E-cadherin at cell junctions during TAM-induced EMT in HMLE/Twist-ER cells, as compared with control cells. (E) Immunoblot analysis of EMT markers in HMLE cells expressing ESRP1 shRNA alone or in combination with CD44 shRNA before (untreated) and after 14 days of TGF-β treatment. Silencing ESRP1 promotes EMT, and loss of CD44 in the ESRP1-silenced cells leads to preservation of expression of epithelial markers E-cadherin, γ-catenin, and occludin and impaired upregulation of mesenchymal markers N-cadherin and vimentin following TGF-β treatment.
Figure 5
Figure 5. CD44s potentiates Akt activation and promotes cell survival in TGF-β–induced mesenchymal MCF10A cells.
(A) Immunoblot analysis of activated Akt (pAkt) in epithelial MCF10A cells (10A) and TGF-β–induced mesenchymal MCF10A cells (10AM), indicating an increased level of Akt phosphorylation in mesenchymal MCF10A cells. Cells were starved for 24 hours and then stimulated with 2 μg/ml insulin. (B) qRT-PCR analysis of E-cadherin levels in TGF-β–treated mesenchymal MCF10A cells treated with DMSO (control) or the PI3K inhibitor LY-294002 (LY; 50 μM) for 20 hours. Error bars indicate SD; n = 3. (C) Immunoblot analysis of pAkt in TGF-β–treated MCF10A cells expressing vector (Ctrl), CD44s, or CD44v. (D) Left: Knockdown efficiency of CD44 shRNA in TGF-β–treated MCF10A cells that predominantly express CD44s. Right: Levels of pAkt after serum starvation for 24 hours, followed by insulin (1 μg/ml) stimulation for 30 minutes, showing that silencing CD44s impairs insulin-stimulated Akt activation. (E) Results of apoptosis assays showing that ectopic expression of CD44s, but not CD44v, inhibits apoptosis in TGF-β–induced mesenchymal MCF10A cells when treated with cisplatin (100 μM) or cultured in suspension. Error bars indicate SEM; n = 3. (F) Results of apoptosis assays showing that treatment with LY-294002, but not the MEK inhibitor U0126, causes an increase in apoptosis in CD44s-expressing TGF-β–induced mesenchymal MCF10A cells. Error bars indicate SEM; n = 4.
Figure 6
Figure 6. A change in expression of CD44 isoforms occurs during murine breast tumor progression.
(A) Semiquantitative RT-PCR analysis of CD44 isoforms indicating differential CD44 isoform expression during progression from HER2/Neu-dependent epithelial primary tumors to HER2/Neu-independent mesenchymal recurrent tumors. (B) qRT-PCR analysis of CD44 isoforms in primary and recurrent tumors. Results are shown as fold change in mRNA level in recurrent tumors relative to that of the primary tumors. Error bars represent SEM; n = 6. (C) Immunoblot analysis of CD44 isoforms in HER2/Neu primary and recurrent tumor cell lines.
Figure 7
Figure 7. CD44s is required for EMT-associated tumor formation in vivo and confers resistance to cell death.
(A) Immunoblot analysis of CD44 in recurrent tumor cells expressing nonspecific (Ctrl) or CD44 (shCD44) shRNA. (B and C) Depletion of CD44s inhibits the formation of EMT-associated tumors. Control or CD44 shRNA–expressing recurrent tumor cells (5 × 10⁵) were injected into the fourth mammary fat pad of female FVB mice. Mice were sacrificed 3 weeks after inoculation, and tumors were removed and weighed. (B) Tumor incidence indicates percentage of mice in each group that formed tumors. Error bars indicate SD of 2 independent experiments (≥13 mice per group per experiment). (C) Tumor burden indicates average total tumor weight (mg) per mouse. Error bars represent SEM; n = 27 (control), n = 26 (shCD44). P values were calculated using a 2-tailed Student’s t test. (D) Tumor incidence in FVB mice injected with 500 control or shCD44-expressing recurrent tumor cells into the fourth mammary fat pad. (E) Results of cytotoxicity assays indicating that knockdown of CD44s promotes cell death induced by UV irradiation (2 kJ/m2) or cisplatin (500 μM). Error bars indicate SEM; n = 3. (F) Immunoblot analysis of CD44 and Bcl-2 expression in recurrent tumor cells expressing shCD44 and reconstituted with CD44s.
Figure 8
Figure 8. The CD44s isoform is enriched in advanced human breast cancers and correlates with N-cadherin expression.
(A) The relative levels of CD44s expression in individual human samples from normal breast tissue or tumors were compared in different groups according to tumor grade. P values were calculated using a 2-tailed Student’s t test. (B) The relative level of CD44s mRNA in each tumor sample was plotted against its corresponding level of N-cadherin mRNA. Spearman correlation analysis shows a significant correlation between CD44s and N-cadherin expression (Spearman correlation coefficient, r = 0.7814, with P < 0.0001).

References

    1. Moody SE, et al. The transcriptional repressor Snail promotes mammary tumor recurrence. Cancer Cell. 2005;8(3):197–209. doi: 10.1016/j.ccr.2005.07.009. - DOI - PubMed
    1. Thiery JP, Sleeman JP. Complex networks orchestrate epithelial-mesenchymal transitions. Nat Rev Mol Cell Biol. 2006;7(2):131–142. doi: 10.1038/nrm1835. - DOI - PubMed
    1. Yang J, et al. Twist, a master regulator of morphogenesis, plays an essential role in tumor metastasis. Cell. 2004;117(7):927–939. doi: 10.1016/j.cell.2004.06.006. - DOI - PubMed
    1. Yang J, Weinberg RA. Epithelial-mesenchymal transition: at the crossroads of development and tumor metastasis. Dev Cell. 2008;14(6):818–829. doi: 10.1016/j.devcel.2008.05.009. - DOI - PubMed
    1. Bolos V, Peinado H, Perez-Moreno MA, Fraga MF, Esteller M, Cano A. The transcription factor Slug represses E-cadherin expression and induces epithelial to mesenchymal transitions: a comparison with Snail and E47 repressors. J Cell Sci. 2003;116(pt 3):499–511. doi: 10.1242/jcs.00224. - DOI - PubMed

Publication types