. 2011 Mar;121(3):930-40.
doi: 10.1172/JCI43871.

Direct regulation of complex I by mitochondrial MEF2D is disrupted in a mouse model of Parkinson disease and in human patients

Affiliations

Direct regulation of complex I by mitochondrial MEF2D is disrupted in a mouse model of Parkinson disease and in human patients

Hua She et al. J Clin Invest. 2011 Mar.

Abstract

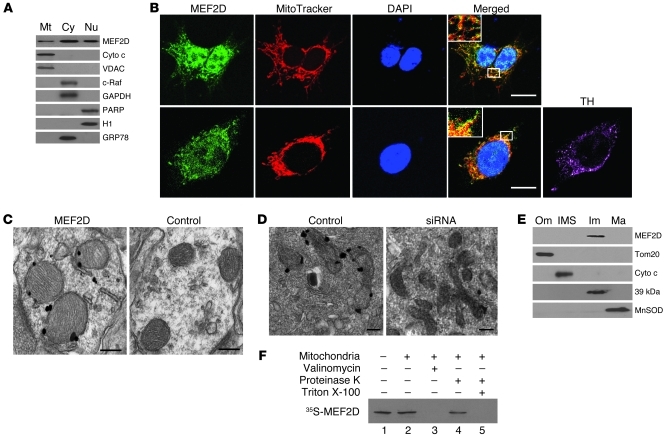
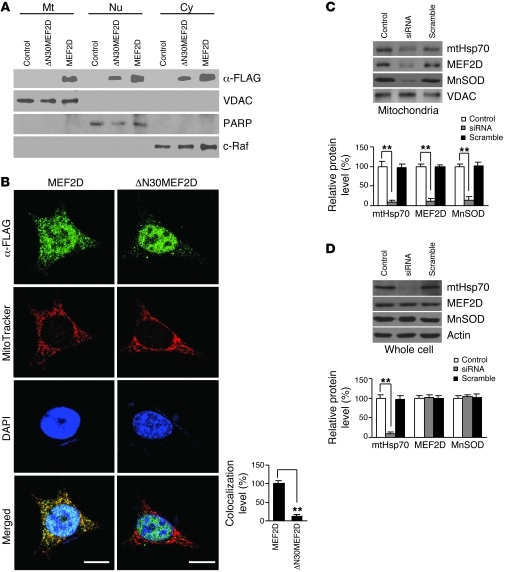
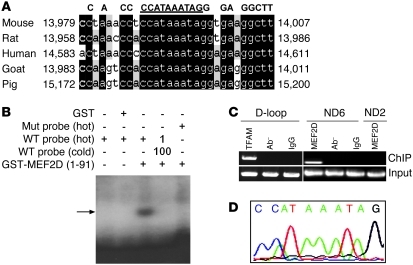
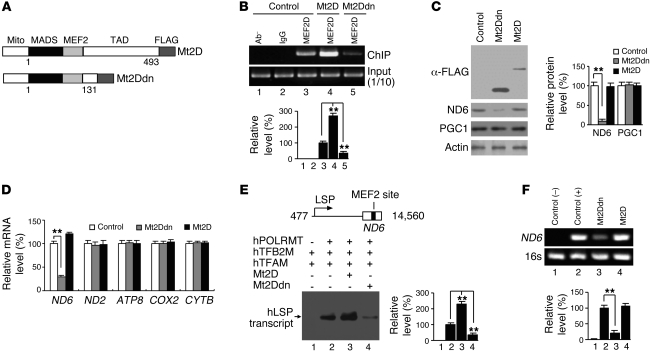
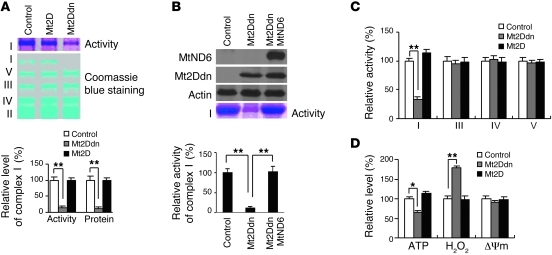
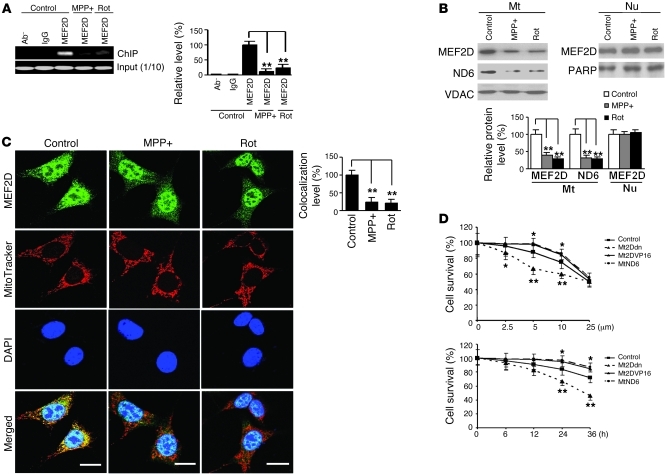
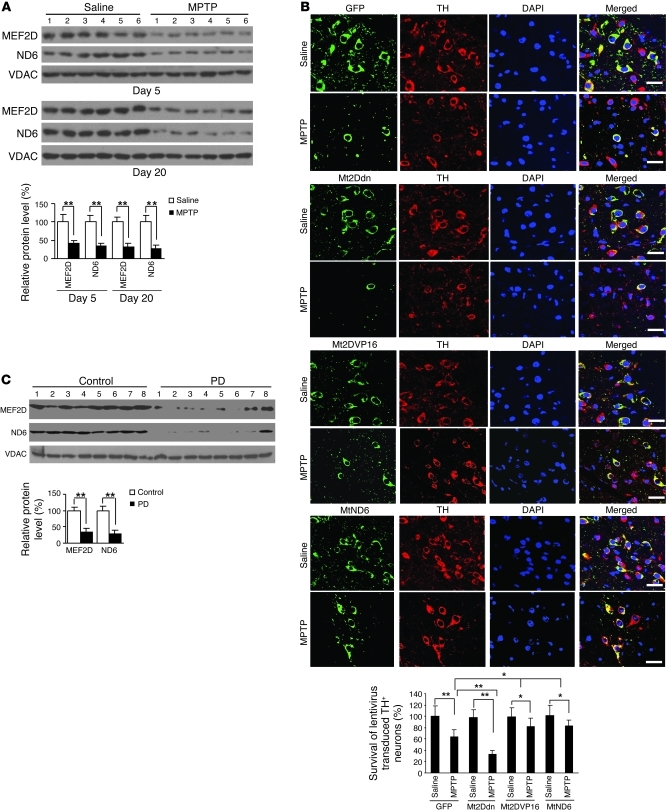
The transcription factors in the myocyte enhancer factor 2 (MEF2) family play important roles in cell survival by regulating nuclear gene expression. Here, we report that MEF2D is present in rodent neuronal mitochondria, where it can regulate the expression of a gene encoded within mitochondrial DNA (mtDNA). Immunocytochemical, immunoelectron microscopic, and biochemical analyses of rodent neuronal cells showed that a portion of MEF2D was targeted to mitochondria via an N-terminal motif and the chaperone protein mitochondrial heat shock protein 70 (mtHsp70). MEF2D bound to a MEF2 consensus site in the region of the mtDNA that contained the gene NADH dehydrogenase 6 (ND6), which encodes an essential component of the complex I enzyme of the oxidative phosphorylation system; MEF2D binding induced ND6 transcription. Blocking MEF2D function specifically in mitochondria decreased complex I activity, increased cellular H(2)O(2) level, reduced ATP production, and sensitized neurons to stress-induced death. Toxins known to affect complex I preferentially disrupted MEF2D function in a mouse model of Parkinson disease (PD). In addition, mitochondrial MEF2D and ND6 levels were decreased in postmortem brain samples of patients with PD compared with age-matched controls. Thus, direct regulation of complex I by mitochondrial MEF2D underlies its neuroprotective effects, and dysregulation of this pathway may contribute to PD.


Figures

Figure 1
Figure 1. Localization of MEF2D in mitochondria of neuronal cells.
(A) Localization of MEF2D in mitochondria of SN4741 cells (n = 3). Cyto c and VDAC are mitochondrial (Mt) markers; c-Raf and GAPDH are cytoplasmic (Cy) markers; PARP and histone H1 are nuclear (Nu) markers; GRP78 is a ER marker. (B) Colocalization of MEF2D with MitoTracker in both SN4741 cells and primary rat midbrain DA neurons (n = 4). TH is a DA neuron marker. Scale bars: 10 μm. Inset original magnification, ×1,000. (C) Localization of MEF2D in rat brain mitochondria under TEM. The control is without primary antibody (n = 4). Scale bars: 100 nm. (D) Localization of MEF2D in mitochondria of SN4741 cells under TEM (n = 4). Scale bars: 50 nm. (E) Localization of MEF2D in the inner membrane of rat brain mitochondria. Tom20, Cyto c, complex I 39-kDa protein, and MnSOD are markers for mitochondrial outer membrane (Om), inter-membrane space (IMS), inner membrane (Im), and matrix (Ma), respectively. n = 3. (F) In vitro mitochondrial import of MEF2D. Lane 1, MEF2D control (1:10 input); lane 2, imported MEF2D; lane 3, valinomycin-induced (20 μM) loss of membrane potential on MEF2D import; lane 4, resistance to proteinase K digestion after MEF2D import; lane 5, complete digestion of MEF2D by proteinase K after solubilization of mitochondria with Triton X-100. n = 3.
Figure 2
Figure 2. Specific sequence and chaperone protein required for localization of MEF2D to mitochondria.
(A) Lack of mitochondrial localization by ΔN30MEF2D. Western blotting showed the presence of overexpressed ΔN30MEF2D in cytoplasmic and nuclear fractions, but not in the mitochondrial fraction, of SN4741 cells (n = 3). VDAC, PARP, and c-Raf are mitochondrial, nuclear, and cytoplasmic markers, respectively. Control indicates the control vector group. (B) Immunocytochemistry analysis of mitochondrial localization of transfected MEF2D-Flag. Overexpressed ΔN30MEF2D did not colocalize with MitoTracker in SN4741 cells (n = 50 cells; **P < 0.01). Experiments were repeated 4 times. Scale bars: 15 μm. (C and D) Requirement of mtHsp70 for mitochondrial targeting of MEF2D (n = 4; **P < 0.01). Control indicates untreated. Knocking down mouse mtHsp70 by siRNA reduced MEF2D level in purified mitochondria from SN4741 cells (C). Knocking down mouse mtHsp70 by siRNA did not reduce whole cell MEF2D level in SN4741 cells (D). MnSOD is a known mtHsp70-imported mitochondrial matrix protein.
Figure 3
Figure 3. Identification of MEF2D regulatory target in mtDNA.
(A) Presence of a conserved MEF2 consensus site in ND6 gene in mtDNA of different species. Underlined sequence indicates the MEF2 consensus site. Black-shaded areas show the conversed MEF2 site and sequences around it in ND6. (B) Specific binding of MEF2D to the consensus site in ND6 in vitro (n = 3). EMSA assay revealed that MEF2D bound to WT but not mutant (Mut) probe. Arrow indicates the specific binding complex. GST, glutathione S-transferase; GST-MEF2D(1-91), GST-fused MEF2D1–91 aa. Hot and cold refer to labeled and unlabeled probes, respectively. (C) Binding of MEF2D to the consensus site in ND6 in cells in vivo (n = 3). ChIP assay showed that MEF2D binds to ND6 in SN4741 cells. A fragment bound by anti-MEF2D antibody could only be specifically amplified by PCR with ND6 primers after immunoprecipitation. TFAM, a known mtDNA D-loop binding protein, was used as a control. Ab, without primary antibody. (D) Sequence analysis of the purified PCR fragment bound by anti-MEF2D antibody in C confirmed that it is the predicted ND6 fragment and contains the MEF2 consensus sequence.
Figure 4
Figure 4. Regulation of mitochondrial gene ND6 by mitochondrial MEF2D.
(A) Mt2D and Mt2Ddn, which lacks the transactivation domain (TAD). Mito, mitochondrial targeting sequence; MADS, minichromosome maintenance 1, agamous, deficiens, and serum response factor domain. (B) Effects of Mt2D and Mt2Ddn on binding of full-length MEF2D to ND6 gene in mitochondria of SN4741 cells, revealed by ChIP assay (n = 4; **P < 0.01). Control indicates the control vector group. (C) Effects of Mt2D or Mt2Ddn on ND6 expression in SN4741 cells. Overexpression of Mt2Ddn in SN4741 cells reduced ND6, but not PPAR-γ coactivator 1 (PGC1), expression (n = 4; **P < 0.01). Control indicates the control vector group. (D) Effects of overexpression of Mt2D or Mt2Ddn on mRNA levels of mitochondria encoded genes. Real-time PCR results showed specific reduction of ND6 mRNA level by overexpression of Mt2Ddn in SN4741 cells (n = 4; **P < 0.01). Control indicates the control vector group. (E) Effects of Mt2D or Mt2Ddn on mtDNA L-strand transcription initiation in vitro (n = 3; **P < 0.01). A human mtDNA fragment containing mitochondrial L-strand promoter (LSP) and ND6 gene was used in the in vitro transcription assay. Blot shows 32P-UTP–labeled transcripts. (F) Effects of Mt2D or Mt2Ddn on mtDNA de novo transcription in vivo (n = 3; **P < 0.01). Control(-) is without primers. Control(+) indicates the control vector group.
Figure 5
Figure 5. Specific modulation of complex I activity by mitochondrial MEF2D.
(A) Requirement of mitochondrial MEF2D for complex I activity. Overexpression of Mt2Ddn reduced mitochondrial complex I activity, revealed by BN-PAGE and in-gel activity staining. Coomassie blue staining showed specific reduction of complex I protein level after overexpression of Mt2Ddn (n = 3; **P < 0.01). Control indicates the control vector group. (B) Overexpression of ND6 rescued complex I activity reduced by Mt2Ddn. Control indicates the control vector group. (C) Measurement of various complex activities. Quantitative analysis of mitochondrial complex activities showed specific reduction of complex I activity by Mt2Ddn in SN4741 cells (n = 4; **P < 0.01). Control indicates the control vector group. (D) Effect of overexpression of Mt2D or Mt2Ddn on mitochondrial function. Mt2Ddn reduced cellular ATP level and elevated H2O2 production in SN4741 cells (n = 4; *P < 0.05, **P < 0.01). Δym, loss of mitochondrial membrane potential. Control indicates the control vector group.
Figure 6
Figure 6. Inhibition of mitochondrial MEF2D by toxic signals relevant to PD.
(A) Reduced binding of MEF2D to ND6 after neurotoxin treatment. SN4741 cells were treated with MPP+ (25 μM) or rotenone (Rot, 100 nM) for 12 hours. ChIP assay showed that binding of MEF2D to ND6 was greatly reduced (n = 4; **P < 0.01). Control indicates untreated. (B) Reduced mitochondrial MEF2D and ND6 protein levels after neurotoxin treatment. Western blotting showed that levels of MEF2D and ND6 in purified mitochondria, but not in nuclei, were significantly reduced (n = 4; **P < 0.01). Control indicates untreated. (C) Immunocytochemical analysis of mitochondrial MEF2D after MPP+ and rotenone treatment. MPP+ and rotenone preferentially reduced colocalization of MEF2D with MitoTracker (n = 50 cells; **P < 0.01). Scale bars: 10 μm. Experiments were repeated 4 times. Control indicates untreated. (D) Effect of mitochondrial MEF2D-ND6 pathway on MPP+ toxicity in SN4741 cells. SN4741 cells were treated with MPP+ after infection with the control or with Mt2Ddn, Mt2DVP16, or MtND6 lentiviruses. Treatment was either with different doses for 24 hours (top) or the 5-μM dose for different times (bottom). Cell viability was measured by WST-1 assay (n = 4; *P < 0.05; **P < 0.01). Control indicates the control vector group.
Figure 7
Figure 7. Correlation of mitochondrial MEF2D in a MPTP model of PD and in postmortem brains of PD patients.
(A) Reduced mitochondrial MEF2D and ND6 levels in the brains of MPTP-treated mice (n = 18; **P < 0.01). Mitochondria purified from brain SNpc region were analyzed by Western blotting. Experiments were repeated 3 times. (B) Role of mitochondrial MEF2D-ND6 pathway in maintaining TH+ neurons in SNpc in a MPTP mouse model of PD. For each group, 3 mice received stereotactic injection of control vector (GFP) or Mt2Ddn lentivirus in SN. 2 weeks later, mice were exposed to MPTP. After treatment for 7 days, survival of lentivirus-transduced TH+ neurons in SN was determined by immunohistochemistry. Scale bars: 30 μm. Quantitative analysis of 9 mice from 3 independent experiments is also shown (**P < 0.01). (C) Reduced mitochondrial MEF2D and ND6 levels in the brains of human PD patients. Mitochondria were purified from brain striata of postmortem PD patients and normal controls. Equal amounts of mitochondrial proteins were subjected to Western blotting. Quantitative analysis of the bands is also shown (n = 13 patients and 13 controls; *P < 0.01). Experiments were repeated 2 times.

References

    1. Chan DC. Mitochondria: dynamic organelles in disease, aging, and development. Cell. 2006;125(7):1241–1252. - PubMed
    1. Manfredi G, Beal MF. Merging mitochondria for neuronal survival. Nat Med. 2007;13(10):1140–1141. doi: 10.1038/nm1007-1140. - DOI - PubMed
    1. Schapira AH. Mitochondrial disease. Lancet. 2006;368(9529):70–82. doi: 10.1016/S0140-6736(06)68970-8. - DOI - PubMed
    1. Orrenius S, Gogvadze V, Zhivotovsky B. Mitochondrial oxidative stress: implications for cell death. Annu Rev Pharmacol Toxicol. 2007;47:143–183. doi: 10.1146/annurev.pharmtox.47.120505.105122. - DOI - PubMed
    1. Mattson MP, Gleichmann M, Cheng A. Mitochondria in neuroplasticity and neurological disorders. Neuron. 2008;60(5):748–766. doi: 10.1016/j.neuron.2008.10.010. - DOI - PMC - PubMed

Publication types

MeSH terms