. 2011 Apr;13(4):453-60.
doi: 10.1038/ncb2204. Epub 2011 Mar 13.

Lysosomal positioning coordinates cellular nutrient responses

Affiliations

Lysosomal positioning coordinates cellular nutrient responses

Viktor I Korolchuk et al. Nat Cell Biol. 2011 Apr.

Abstract

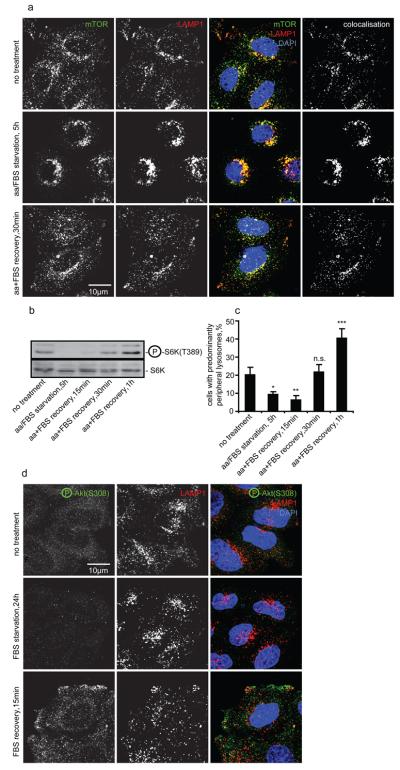
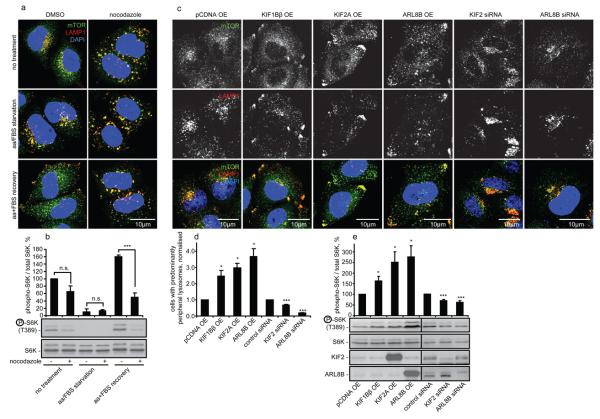
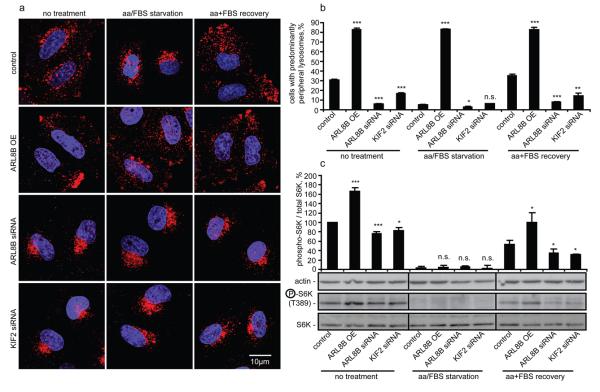
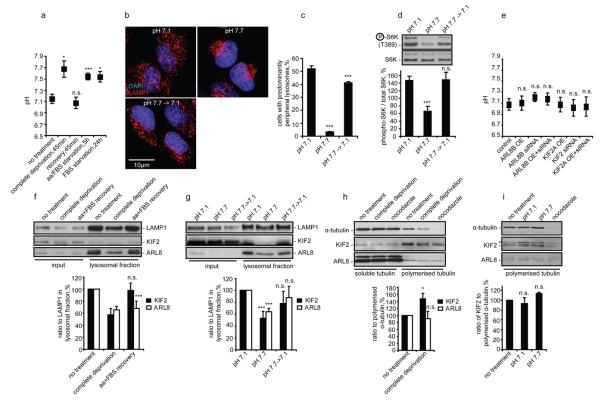
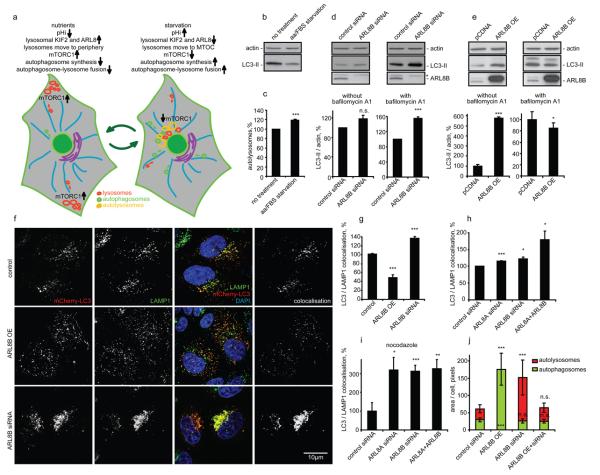
mTOR (mammalian target of rapamycin) signalling and macroautophagy (henceforth autophagy) regulate numerous pathological and physiological processes, including cellular responses to altered nutrient levels. However, the mechanisms regulating mTOR and autophagy remain incompletely understood. Lysosomes are dynamic intracellular organelles intimately involved both in the activation of mTOR complex 1 (mTORC1) signalling and in degrading autophagic substrates. Here we report that lysosomal positioning coordinates anabolic and catabolic responses with changes in nutrient availability by orchestrating early plasma-membrane signalling events, mTORC1 signalling and autophagy. Activation of mTORC1 by nutrients correlates with its presence on peripheral lysosomes that are physically close to the upstream signalling modules, whereas starvation causes perinuclear clustering of lysosomes, driven by changes in intracellular pH. Lysosomal positioning regulates mTORC1 signalling, which in turn influences autophagosome formation. Lysosome positioning also influences autophagosome-lysosome fusion rates, and thus controls autophagic flux by acting at both the initiation and termination stages of the process. Our findings provide a physiological role for the dynamic state of lysosomal positioning in cells as a coordinator of mTORC1 signalling with autophagic flux.


Figures

Fig. 1
Fig. 1
Changes in mTORC1 signalling in response to starvation correlate with lysosomal positioning. (a-c) HeLa cells were either left untreated, amino acid/FBS starved for 5 h, or starved and then recovered in amino acid/FBS-containing medium, then immunostained, or immunoblotted using antibodies as shown. Colocalisation panels show an overlap between mTOR and LAMP1 signals. Note that changes in the positioning of lysosomal mTOR (quantified as a percentage of cells with predominantly peripheral localisation of LAMP1-positive vesicles, (a) and (c)) correlate with mTORC1 activity (levels of phosphorylated S6K relative to the total S6K, (b)). (d) Visualisation of Akt activated in response to recovery after serum starvation. After nutrient recovery, LAMP1-positive vesicles localise to peripheral regions with higher concentrations of phospho-Akt. For all panels, values are means ± s.e.m. of three independent experiments performed in triplicate. * p < 0.05, ** p < 0.01, *** p < 0.005 t-test; other comparisons are not significant (n.s.). Representative maximum intensity projections of serial confocal optical sections are shown. Uncropped images of blots are shown in Supplementary Fig. 7.
Fig. 2
Fig. 2
Factors changing lysosomal positioning also affect mTORC1 signalling. (a) and (b) Nocodazole flattens the differences in lysosomal mTOR localisation and dampens mTORC1 signalling in response to changes in nutrient availability. Cells were treated as in Fig. 1a followed by the incubation with DMSO (vehicle) or with nocodazole during the last 2 h before fixation/lysis. Samples were analysed by immunofluorescence (a) or immunoblotting (b). Quantification of phopho-S6K levels is shown in (b). (c-f) Changes in lysosomal positioning induced by kinesin- or small GTPase-family members (c, d) correlate with changes in mTORC1 activity (e). HeLa cells were transfected with overexpression constructs or with siRNA as shown, followed by immunofluorescence (c,d) or by immunoblotting (e) analyses. Values are means ± s.e.m. of three independent experiments performed in triplicate. All comparisons are with the control within each treatment condition, * p < 0.05, *** p < 0.005 t-test; n.s. not significant. Uncropped images of blots are shown in Supplementary Fig. 7.
Fig. 3
Fig. 3
Lysosomal positioning regulates recovery of mTOR signalling after starvation. (a-c) HeLa cells transfected with ARL8B or KIF2 siRNA, or with ARL8B overexpression construct (non-targeting siRNA and empty pCDNA vector used as transfection controls), were either left untreated, serum/amino acid starved for 5 h, or starved and then recovered in amino acid and FBS containing medium for 30 min. Cells were immunostained using LAMP1 antibody (a) and the percentage of cells with predominantly peripheral localisation of LAMP1-positive vesicles was quantified (b) or subjected to immunoblotting (c) using antibodies as shown. Quantification of phospho-S6K levels relative to the total S6K is shown in (c). Values are means ± s.e.m. of three independent experiments performed in triplicate. All comparisons are with the control within each treatment condition, * p < 0.05, ** p < 0.01, *** p < 0.005 t-test; n.s. not significant. Uncropped images of blots are shown in Supplementary Fig. 7.
Fig. 4
Fig. 4
Nutrients control lysosomal positioning by modulating pHi and lysosomal levels of KIF2 and ARL8B. (a) Starvation increases pHi in HeLa cells allowed to starve using three different protocols (see Methods) with or without subsequent recovery. (b-d) Changing pHi from 7.1 to 7.7 is sufficient to affect localisation of lysosomes and mTORC1 activity. pHi was titrated in full tissue culture medium containing nigericin, which allows one to force changes in pHi by altering pH in the medium, followed by immunostaining (b, c) or western blotting (d) using antibodies as shown. (e) Changes in lysosomal localisation have no effect on pHi. ARL8B and KIF2 were overexpressed or knocked down in HeLa cells followed by pHi measurement. (f, g) Nutrients and pHi affect levels of ARL8 and KIF2 in lysosomal fractions. Protein levels and their quantification in total cellular lysates or in isolated lysosomal fractions from HeLa cells subjected to 1 h nutrient deprivation/recovery (f) or to 1 h changes of pHi in full tissue culture medium containing nigericin (g) are shown. (h, i) Effect of nutrients and pHi on binding of ARL8 and KIF2 to polymerised microtubules. HeLa cells treated as in panels (f) and (g), followed by isolation of polymerised microtubule fraction and western blotting. Asterisk indicates a nonspecific band. For all panels values are means ± s.e.m. of three independent experiments performed in triplicate. All comparisons are with the control within each treatment condition, * p < 0.05, ** p < 0.01, *** p < 0.005 t-test; n.s. not significant. Uncropped images of blots are shown in Supplementary Fig. 7.
Fig. 5
Fig. 5
Lysosomal positioning modulates autophagy. (a) Diagram illustrating how lysosomal positioning coordinates mTOR signalling and autophagy. Peripheral lysosomal localisation (nutrient-induced) increases mTOR activity (blocking autophagosome synthesis) and reduces autophagosome-lysosome fusion. Starvation-induced lysosomal clustering reduces mTOR activity (activating autophagosome synthesis) and facilitates autophagosome-lysosome fusion. (b, c) 5 h serum and amino acid starvation of HeLa cells reduces LC3-II levels (b), but increases autolysosome numbers detected using tfLC3 (c). With tfLC3, GFP- and RFP-positive puncta represent autophagosomes prior to lysosomal fusion, while RFP-positive/GFP-negative puncta represent autolysosomes - GFP is more rapidly quenched by low lysosomal pH (see Methods). Increased autolysosomes suggest enhanced starvation-induced flux of LC3 to lysosomes. (d) ARL8B knockdown increases autophagosomal synthesis. siRNA-transfected HeLa cells were incubated for 48 h, then left untreated or incubated with bafilomycin A1. LC3-II levels versus actin were quantified (bottom graphs). Asterisk: nonspecific band. (e) ARL8B overexpression inhibits autophagosome synthesis and degradation. HeLa cells overexpressing ARL8B or empty vector were analysed as in (d). (f) HeLa cells were cotransfected with either ARL8B overexpression construct or siRNA (non-targeting siRNA and empty pEGFP vector were transfection controls) together with mCherry-LC3 for 48 h. After fixation, cells were stained for endogenous LAMP1 and DNA (DAPI). Representative maximum intensity projections of serial confocal optical sections are shown. Colocalisation panels show overlapping mCherry-LC3 and LAMP1 signals. (g-i) Quantification of autophagosome-lysosome fusion in HeLa cells. Percentages of autolysosomes (positive for both mCherry-LC3 and LAMP1) to autophagosomes (positive for mCherry-LC3 and negative for LAMP1) were quantified. In panel (i), we analysed cells treated for 2 h with nocodazole before fixation, which dispersed the perinuclear lysosomal cluster (see Fig. 2a). (j) Autophagosomal and autolysosomal numbers in tfLC3-expressing cells after ARL8B overexpression and knockdown. (Fig. S5o shows representative cells). In panels (g-j) we analysed 20 cells/group in three independent experiments. Values are means ± s.e.m of three independent experiments performed in triplicate. * p < 0.05, ** p < 0.01, *** p < 0.005 t-test; other comparisons not significant (n.s.). Uncropped images of blots are shown in Supplementary Fig. 7.

Comment in

Similar articles

Cited by

References

    1. Heuser J. Changes in lysosome shape and distribution correlated with changes in cytoplasmic pH. J Cell Biol. 1989;108:855–864. - PMC - PubMed
    1. Luzio JP, Pryor PR, Bright NA. Lysosomes: fusion and function. Nat Rev Mol Cell Biol. 2007;8:622–632. - PubMed
    1. Sancak Y, et al. Ragulator-Rag Complex Targets mTORC1 to the Lysosomal Surface and Is Necessary for Its Activation by Amino Acids. Cell. 2010 - PMC - PubMed
    1. Sancak Y, et al. The Rag GTPases bind raptor and mediate amino acid signaling to mTORC1. Science. 2008;320:1496–1501. - PMC - PubMed
    1. Jahreiss L, Menzies FM, Rubinsztein DC. The itinerary of autophagosomes: from peripheral formation to kiss-and-run fusion with lysosomes. Traffic. 2008;9:574–587. - PMC - PubMed

Publication types

Substances