. 2011 Sep;66(3):658-68.
doi: 10.1002/mrm.22844. Epub 2011 Mar 9.

Multipathway sequences for MR thermometry

Affiliations

Multipathway sequences for MR thermometry

Bruno Madore et al. Magn Reson Med. 2011 Sep.

Abstract

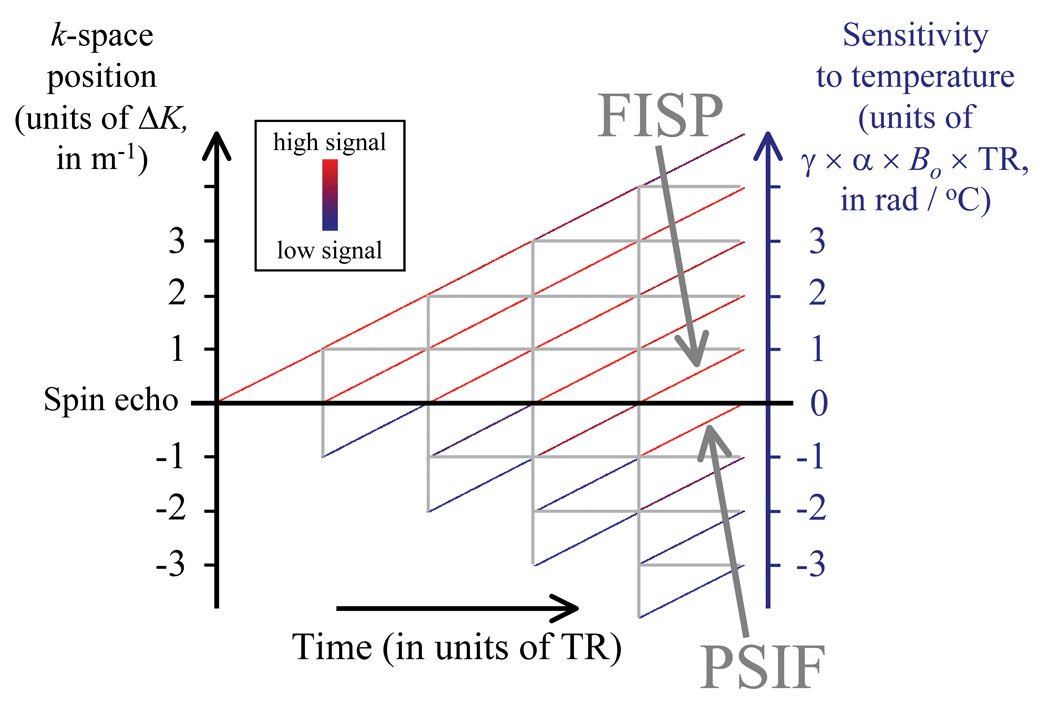
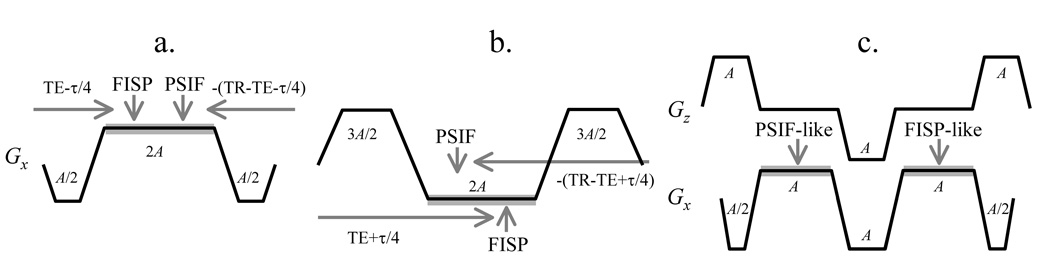
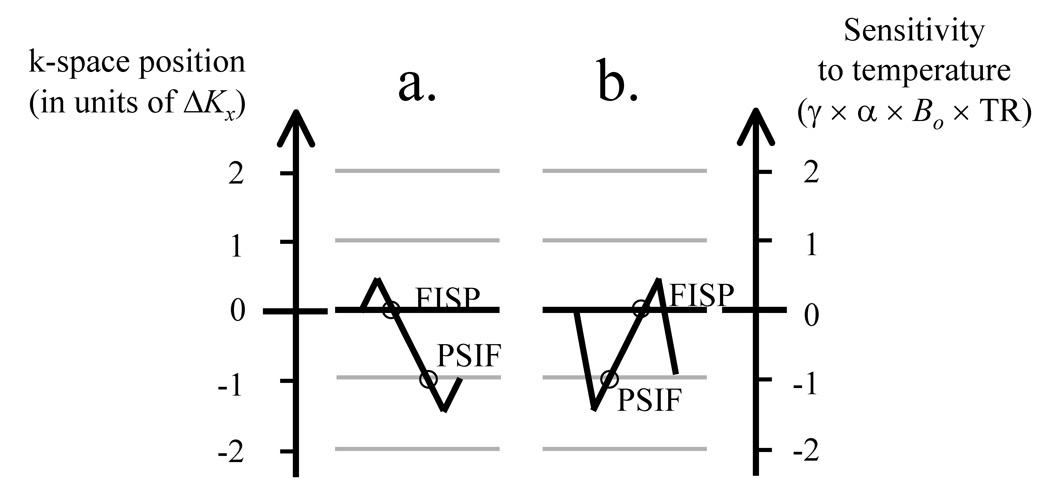
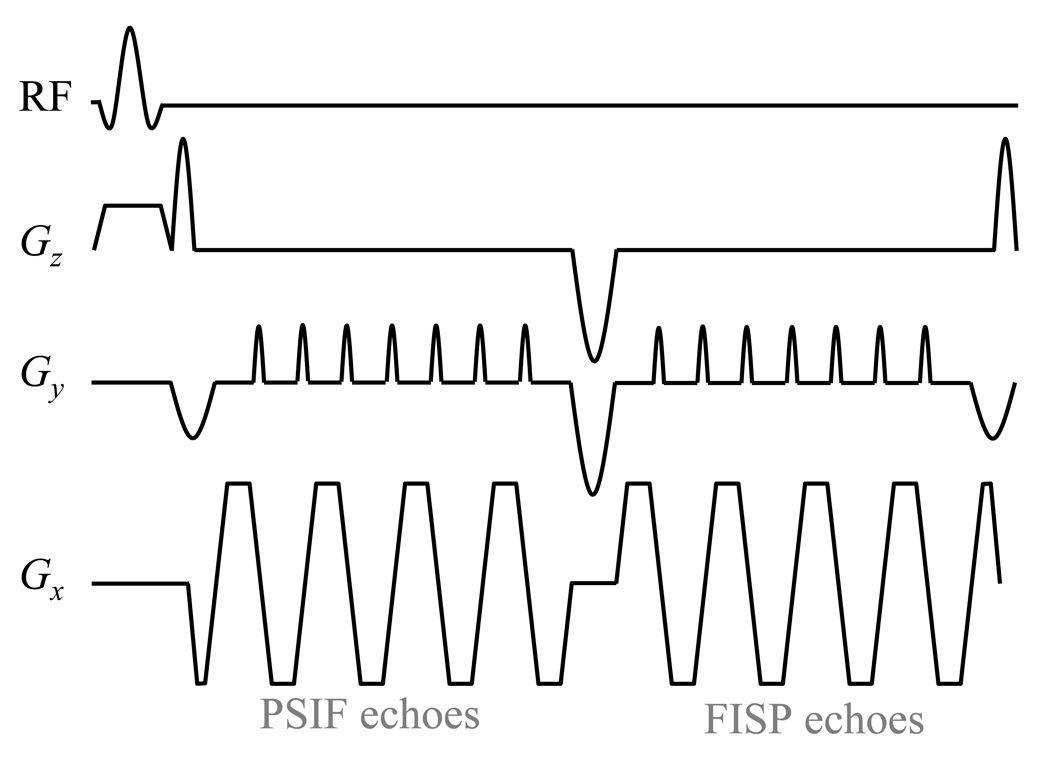
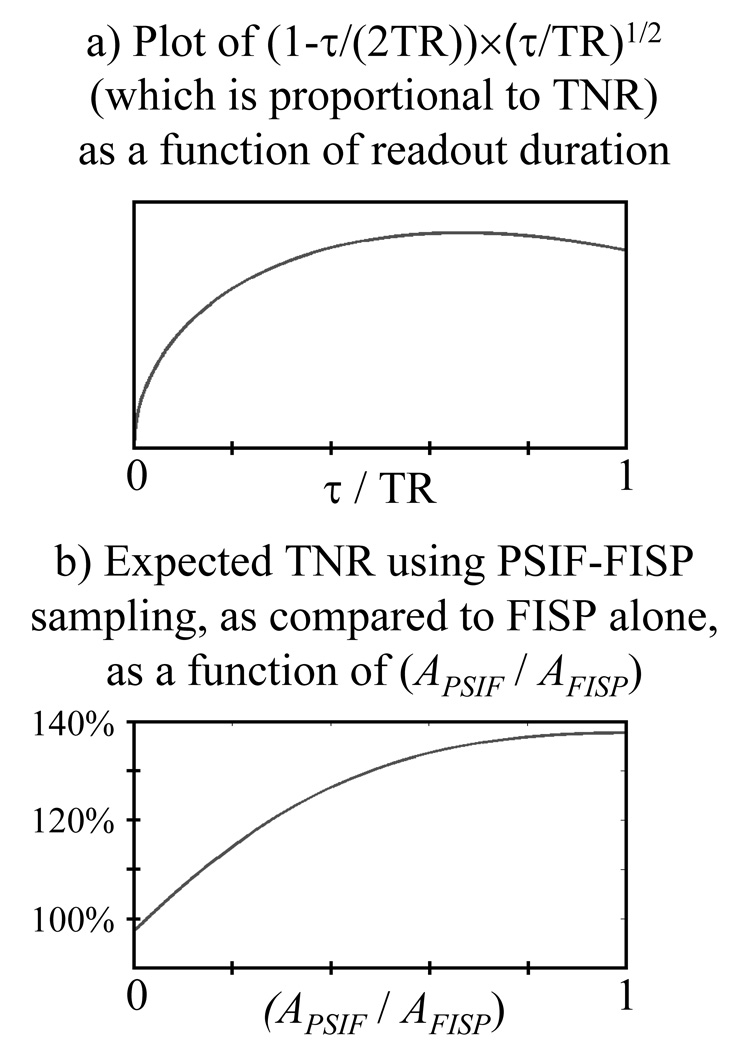
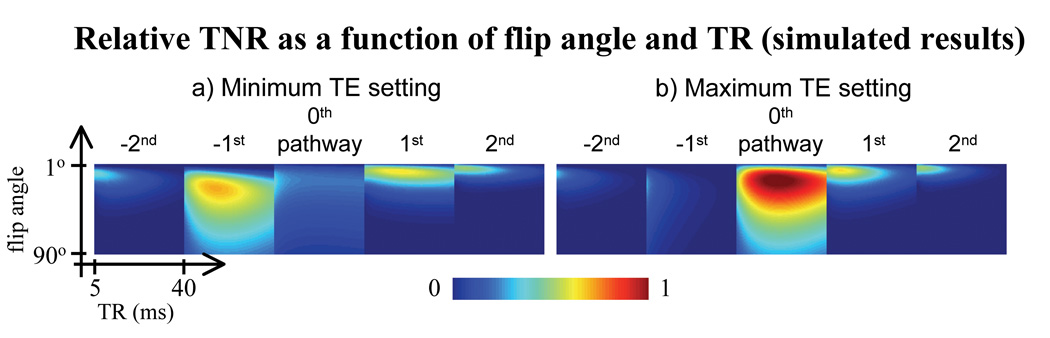
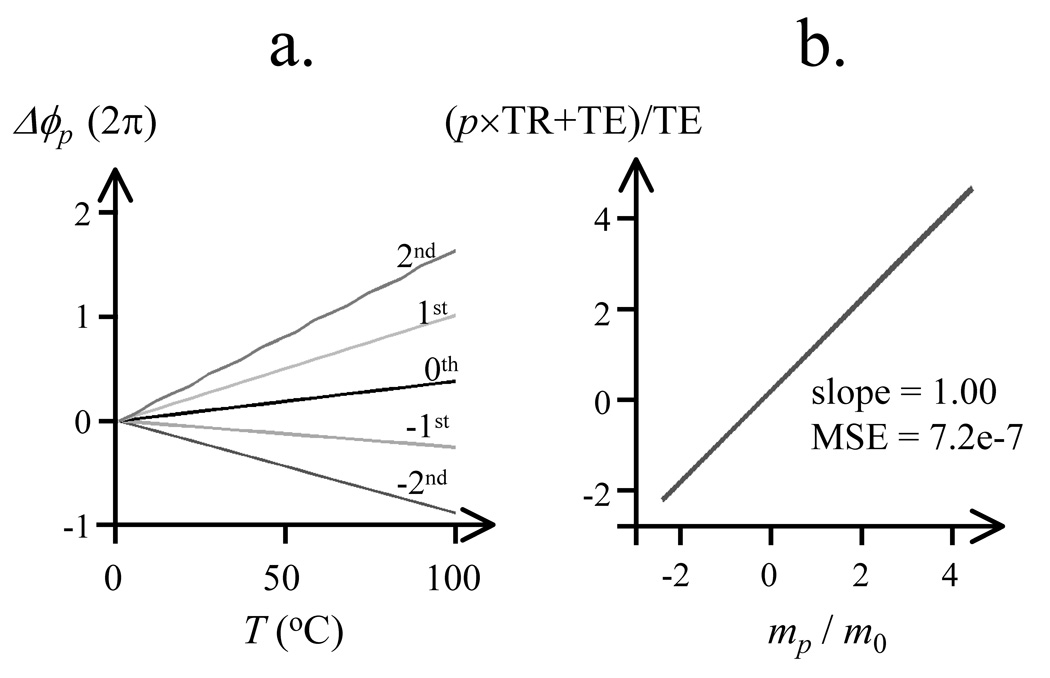
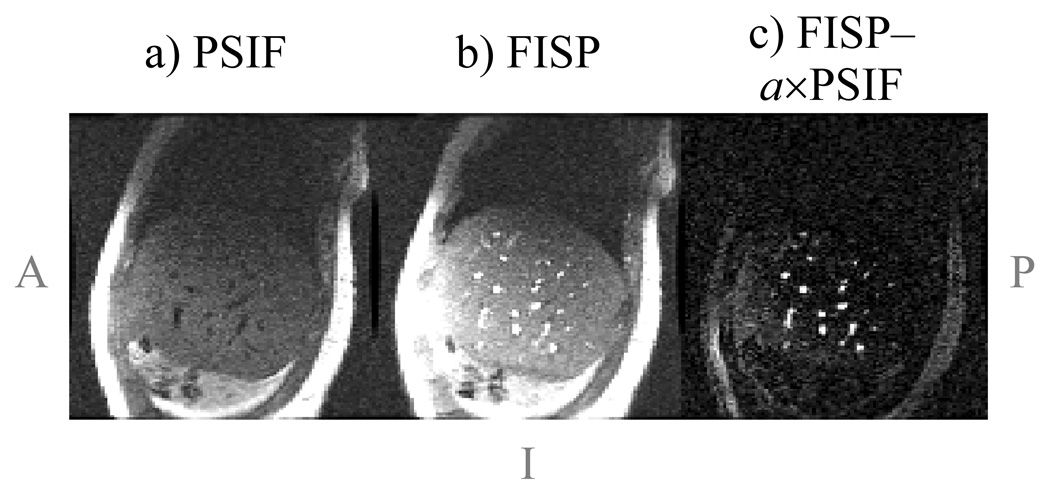
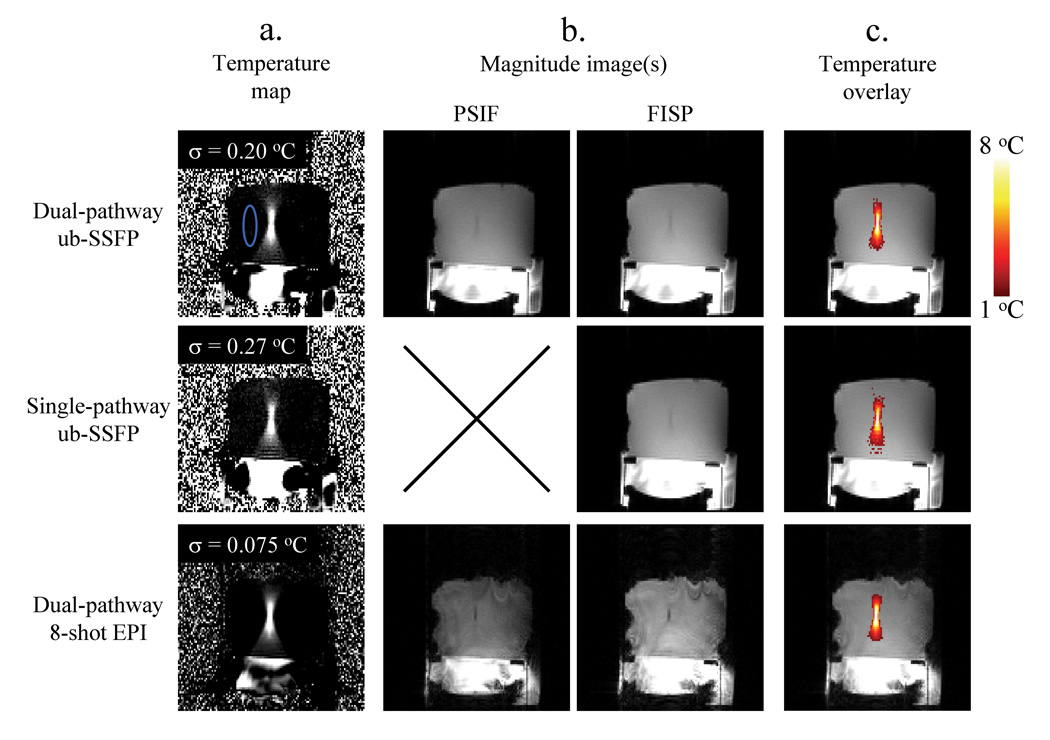
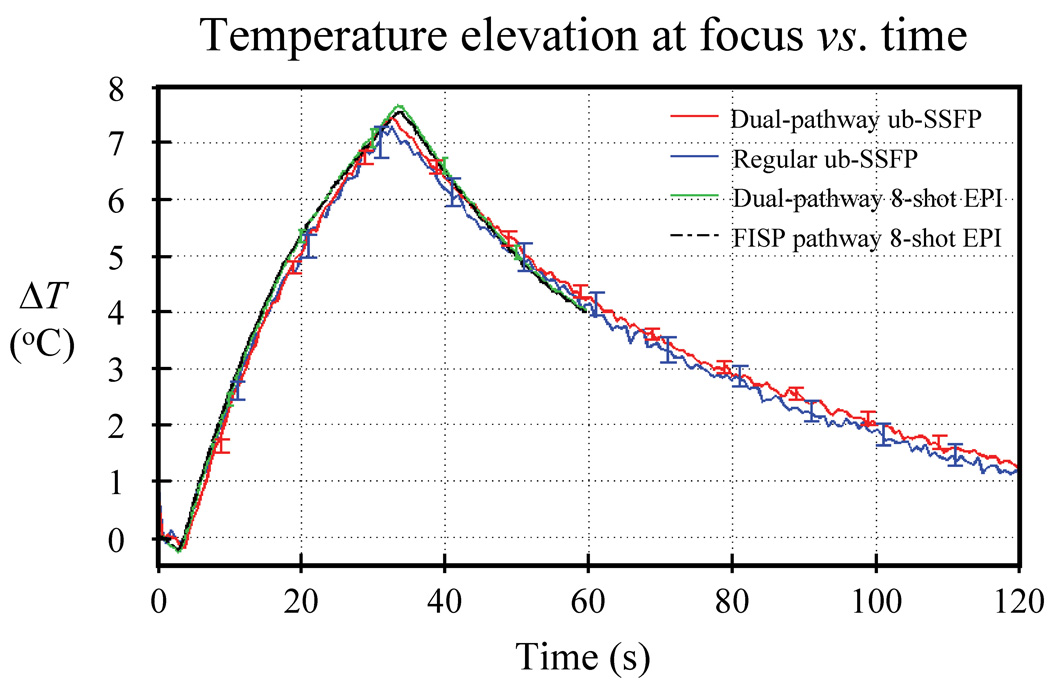
MR-based thermometry is a valuable adjunct to thermal ablation therapies as it helps to determine when lethal doses are reached at the target and whether surrounding tissues are safe from damage. When the targeted lesion is mobile, MR data can further be used for motion-tracking purposes. The present work introduces pulse sequence modifications that enable significant improvements in terms of both temperature-to-noise-ratio properties and target-tracking abilities. Instead of sampling a single magnetization pathway as in typical MR thermometry sequences, the pulse-sequence design introduced here involves sampling at least one additional pathway. Image reconstruction changes associated with the proposed sampling scheme are also described. The method was implemented on two commonly used MR thermometry sequences: the gradient-echo and the interleaved echo-planar imaging sequences. Data from the extra pathway enabled temperature-to-noise-ratio improvements by up to 35%, without increasing scan time. Potentially of greater significance is that the sampled pathways featured very different contrast for blood vessels, facilitating their detection and use as internal landmarks for tracking purposes. Through improved temperature-to-noise-ratio and lesion-tracking abilities, the proposed pulse-sequence design may facilitate the use of MR-monitored thermal ablations as an effective treatment option even in mobile organs such as the liver and kidneys.


Figures

Fig. 1
Fig. 1
A graphical tool based on so-called phase-diagrams was developed to help guide pulse sequence developments in PRF thermometry. As an RF pulse is applied on each TR, different magnetization pathways develop, shown here as colored diagonal segments. The FISP (in the [0,1] interval) and the PSIF (in the [−1,0] interval) are of particular importance. The displayed signal levels were obtained with T1 = 800 ms, T2 = 35 ms and T2* = 20 ms (relaxation times typical for liver tissues at 3 T), along with TR = 5 ms and φRF = 30°. While only a few TR periods could be displayed here, many more TR periods are necessary to reach a steady-state signal.
Fig. 2
Fig. 2
Examples of x gradient waveforms that can be used to sample both a FISP and a PSIF echo. Data-sampling windows are shown as thick gray lines along the Gx(t) waveform. a) Both the so-called ‘FISP’ and ‘PSIF’ echoes are sensitive to temperature, and this sensitivity is proportional to the length of the horizontal gray arrows, TE-τ/4 and TR-TE-τ/4. τ is the readout duration, and A is the gradient area corresponding to a k-space offset of ΔK (Fig. 1). b) While the FISP was sampled first in (a), here the PSIF is sampled first for improved temperature sensitivity, as seen from the longer horizontal gray arrows. c) A gradient waveform with non-zero total area is associated with flow sensitivity. For example, such sensitivity could be a problem if oriented in the S/I direction, as most organs move mostly along S/I during breathing. In contrast, it can be useful if oriented along the R/L direction, to help detect vessels oriented along R/L. Unlike for the sequence in (b), the sequence in (c) has a gradient imbalance along z (rather than x), showing that the flow-sensitized direction can be rotated.
Fig. 3
Fig. 3
a) Effects of the readout waveforms from Fig. 2a are further described here. The gradient lobes in Fig. 2a cause a move along the ‘k-space position’ axis from 0 to +0.5ΔK, then to −1.5ΔK, and then to −1.0ΔK. A displacement of ΔK corresponds to at least the full width of a k-space matrix, to avoid signal overlap between consecutive pathways. The trajectory finishes at a position −1.0ΔK, and samples the FISP at 0 and then the PSIF at −ΔK along the way. b) The waveform in Fig. 2b causes a move from 0 to −1.5ΔK, then to +0.5ΔK, and finally at −ΔK. Note that, in this case, The PSIF is sampled first. At least in principle, waveforms that sample any number of desired pathways could be designed.
Fig. 4
Fig. 4
The gradient-echo EPI version of the pulse sequence design proposed here is depicted. The readout scheme from Fig. 2c is modified so that single-line readouts are replaced by EPI readouts instead. As in Fig. 2c, ‘superblips’ along the Gz(t) waveform allow PSIF echoes to be acquired first, followed by FISP echoes. Note that the first and last superblips are smaller than the middle one because they were merged with the negative rephaser and dephaser lobes associated with the slice-selective excitation pulse. Because the phantom imaged here was water-based and featured no fat signals, a regular RF pulse was employed, although, for in vivo imaging, it should be replaced with a spectral-spatial pulse.
Fig. 5
Fig. 5
a) Expected TNR as a function of normalized readout time (τ/TR) is plotted here. While for a single pathway an optimum value τ/TR = 2/3 could be used, when sampling two pathways no more than half of TR can be allocated to each pathway. The TNR penalty associated with such reduction in τ is very small, as the value for τ/TR = 1/2 is 97.4% of the maximum value. b) If one further takes into account the TNR benefits of having data from a second pathway (see Eq. 3), a clear TNR improvement is expected as compared to sampling the FISP pathway alone. Note that even for a PSIF signal with half the strength of the FISP signal (i.e., APSIF / AFISP = 0.5), a 31% TNR improvement would still be obtained. In comparison, for APSIF / AFISP = 1.0, an improvement of (0.9742100%)=38% would be obtained instead.
Fig. 6
Fig. 6
Relative TNR, as compared to the maximum TNR case, is shown as a function of TR and flip angle. a) For short TE values, the −1st (PSIF) pathway offers much better TNR than the 0th (FISP) pathway. b) For long TE values, the situation is reversed. For this reason, the preferred multi-pathway sequence involves sampling two pathways, first the PSIF early during the TR period (short TE−1), and the FISP later during TR (long TE0). Other higher-order pathways have less-advantageous TNR properties. Relaxation times consistent with liver imaging were used here (T1 = 800 ms, T2 = 35 ms, T2* = 20 ms).
Fig. 7
Fig. 7
Simulations were performed to validate Eq. 1. The linearity of the relationship between temperature and phase shift was tested in (a) for pathways from −2 to 2. The value of the proportionality constant in these linear relationships was tested in (b), as compared to expected values from Eq. 1. See text for more details.
Fig. 8
Fig. 8
a,b) Liver images were acquired during free breathing using the sequence from Fig. 2c (sagittal plane, 5 slices, 5 mm thick, 128×96, 24×24 cm, TR = 6.4 ms, temporal resolution = 96×6.4 = 614 ms). Because blood vessels tend to appear dark in the PSIF images due to flow effects, acquiring both the FISP and PSIF magnetization pathways as in Fig. 2c greatly facilitates the task of localizing blood vessels for target-tracking purposes. c) A simple subtraction between FISP and PSIF images, using a scalar weight, a, to maximize signal cancellation (a = 1.4 here), yields images of mostly just blood vessels. When viewed in a movie loop, the blood-vessel images clearly capture the (in-plane) changes in liver position and shape caused by breathing. Notice that non-flowing materials such as fat or liver parenchyma have more similar contrast in both images, and appear to be suppressed in (c).
Fig. 9
Fig. 9
Phantom data with FUS heating were acquired using three different 2D pulse sequences: the dual-pathway unbalanced SSFP sequence from Fig. 2c, a regular gradient-echo sequence (i.e., FISP only), and the dual pathway interleaved-EPI sequence from Fig. 4. Temporal resolution was more than two-fold better for EPI than for the ub-SSFP sequence (272 compared to 614 ms). a) Temperature maps are shown for the time frame with maximum heating (about 8 °C at focus). To evaluate temperature noise, the standard deviation was calculated along the time axis for each pixel in the non-heated ROI (shown in blue). Results for all the pixels in this ROI were then averaged and the resulting value is displayed in the upper-left corner of each image in (a). Notice that the dual-pathway ub-SSFP implementation (top row) provides about a 35% improvement in TNR compared to its single-pathway counterpart (middle row), as 0.27 °C / 0.20 °C = 1.35. b) The magnitude component of data employed to generate the images in (a) is also displayed here. Notice that although the EPI implementation (bottom row) provides superior TNR and higher frame rates, the ub-SSFP short-TR implementation (top row) also has value, as it provides better anatomical images with less geometric distortion for potentially superior motion tracking. c) The temperature information from (a) is displayed as an overlay onto the magnitude information from (b). Throughout this figure, the same windowing settings were used whenever comparing results from different sequences or pathways.
Fig. 10
Fig. 10
Temperature curves are shown for all three types of sequences from Fig. 9, as averaged over a 3×3 pixel ROI located at focus. Five repeat-datasets were acquired with each sequence, the average value among repeats was plotted and the standard deviation among repeats was used to generate error bars. Very close temperature agreement was obtained between all three imaging sequences (dual pathway ub-SSFP, regular ub-SSFP and dual-pathway EPI). On average, the curves plotted here differed from each other by only 0.21 °C or less. As a reference, temperature measurements from the usual (FISP) pathway of the dual-pathway EPI sequence are also shown, averaged over all five repeats.

References

    1. Jolesz FA, Bleier AR, Jakab P, Ruenzel PW, Huttl K, Jako GJ. MR imaging of laser-tissue interactions. Radiology. 1988;168:249–253. - PubMed
    1. Parker DL, Smith V, Sheldon P, Crooks LE, Fussell L. Temperature distribution measurements in two-dimensional NMR imaging. Med Phys. 1983;10:321–325. - PubMed
    1. Chen J, Daniel BL, Butts Pauly K. Investigation of proton density for measuring tissue temperature. J Magn Reson Imaging. 2006;23:430–434. - PubMed
    1. Le Bihan D, Delannoy J, Levin RL. Temperature mapping with MR imaging of molecular diffusion: application to hyperthermia. Radiology. 1989;171:853–857. - PubMed
    1. De Poorter J, De Wagter C, De Deene Y, Thomsen C, Stahlberg F, Achten E. Noninvasive MRI thermometry with the proton resonance frequency (PRF) method: in vivo results in human muscle. Magn Reson Med. 1995;33:74–81. - PubMed

Publication types