. 2011 Aug;9(4):403-19.
doi: 10.1089/adt.2010.0314. Epub 2011 Mar 11.

Characterization of an in vitro differentiation assay for pancreatic-like cell development from murine embryonic stem cells: detailed gene expression analysis

Affiliations

Characterization of an in vitro differentiation assay for pancreatic-like cell development from murine embryonic stem cells: detailed gene expression analysis

Chialin Chen et al. Assay Drug Dev Technol. 2011 Aug.

Abstract

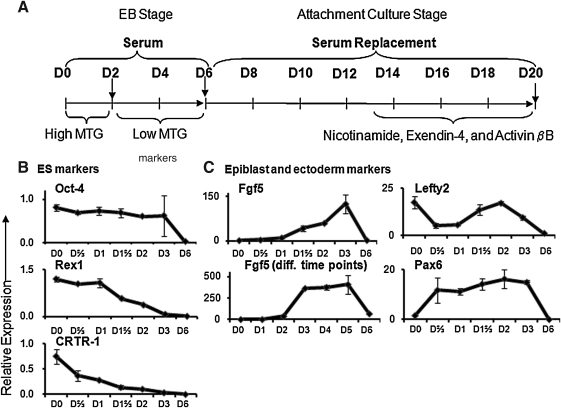
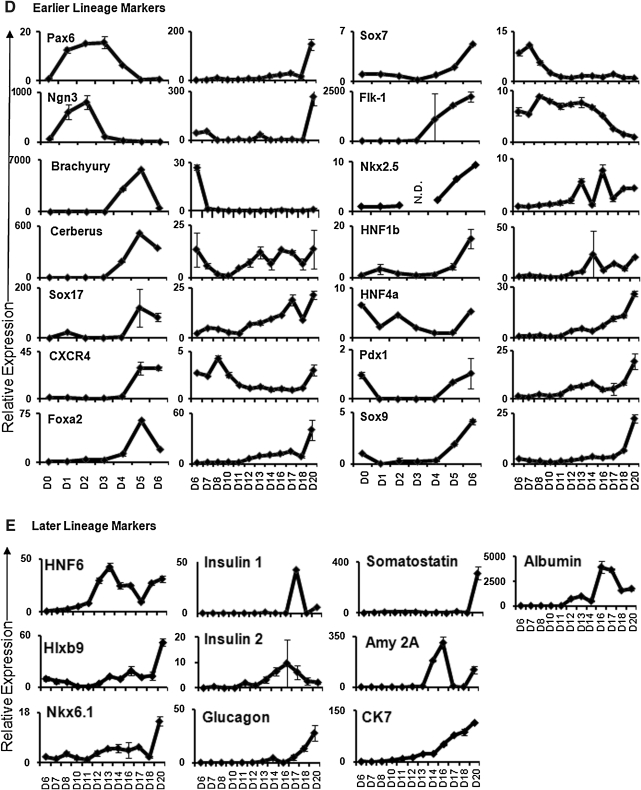
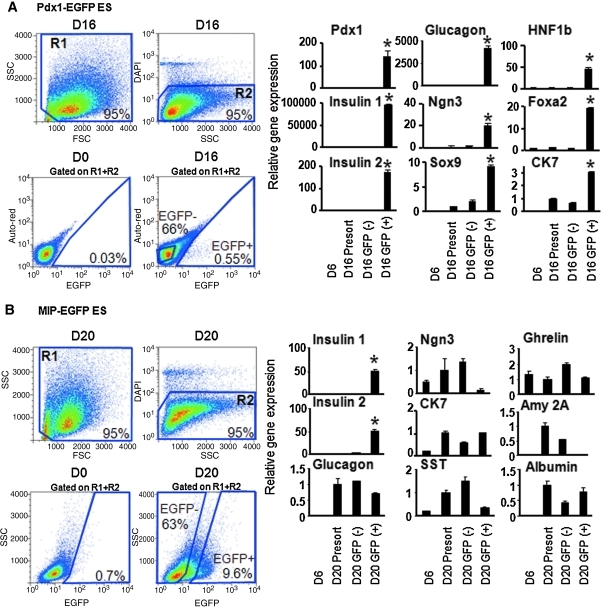
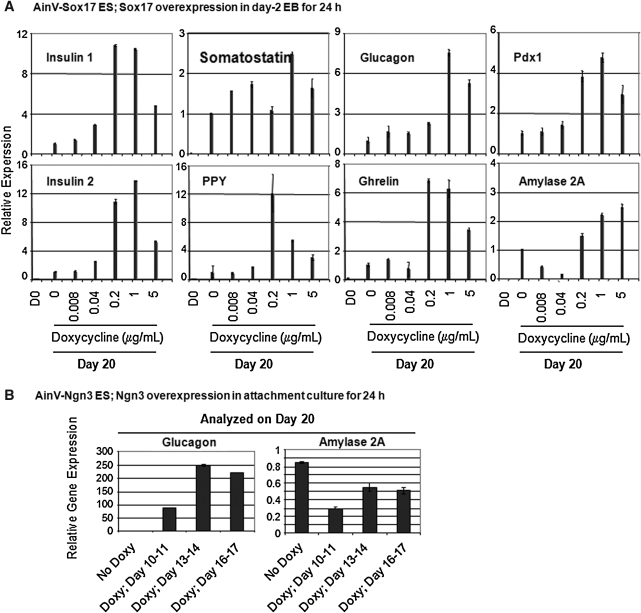
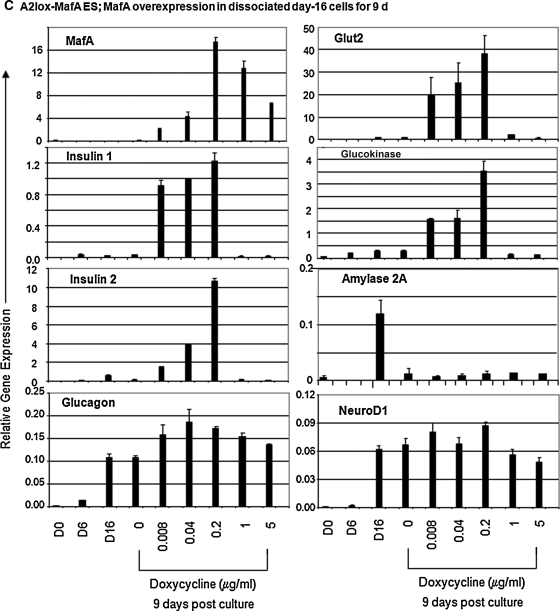
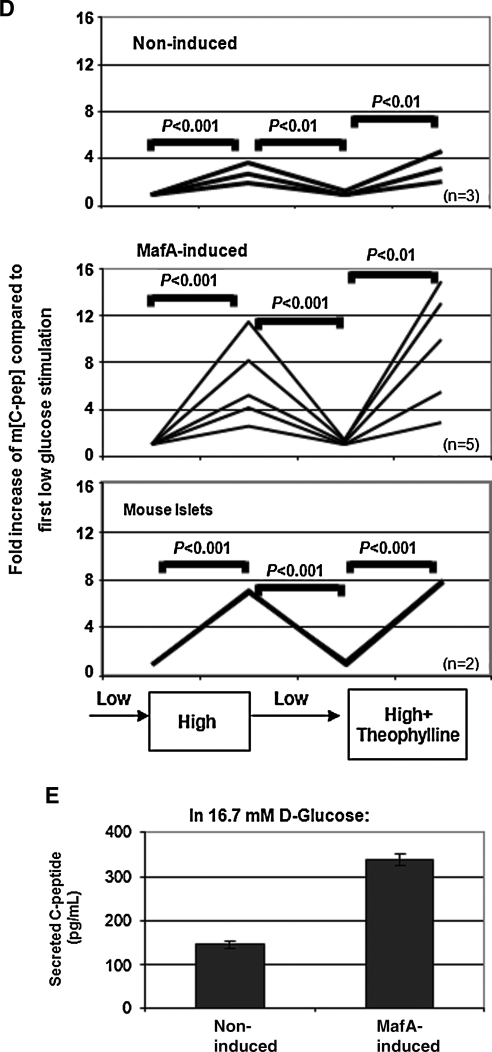
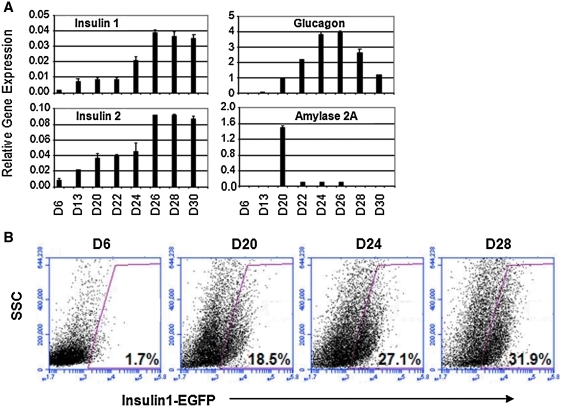
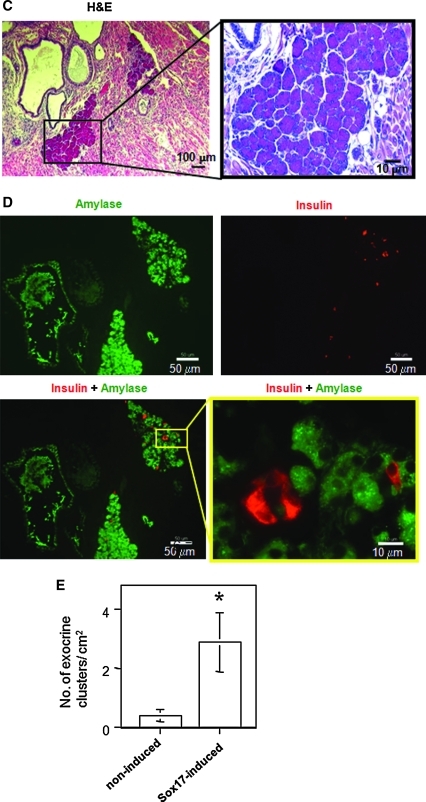
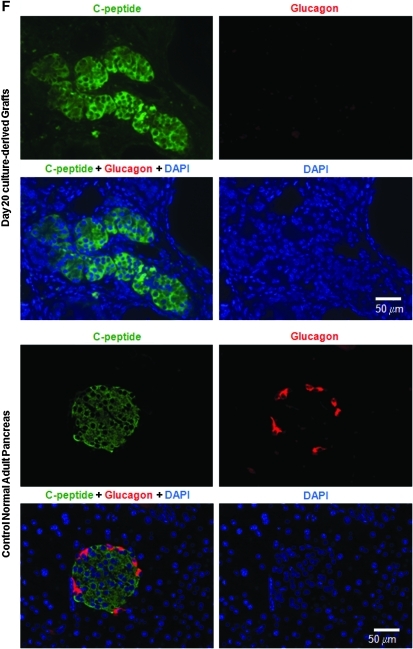
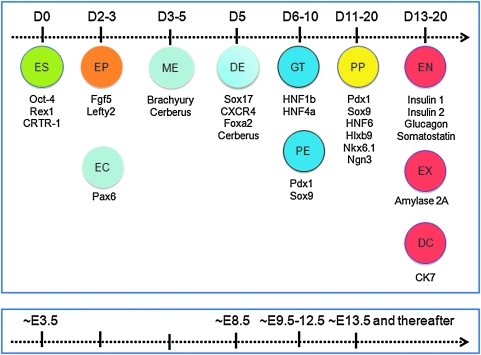
Embryonic stem (ES) cell technology may serve as a platform for the discovery of drugs to treat diseases such as diabetes. However, because of difficulties in establishing reliable ES cell differentiation methods and in creating cost-effective plating conditions for the high-throughput format, screening for molecules that regulate pancreatic beta cells and their immediate progenitors has been limited. A relatively simple and inexpensive differentiation protocol that allows efficient generation of insulin-expressing cells from murine ES cells was previously established in our laboratories. In this report, this system is characterized in greater detail to map developmental cell stages for future screening experiments. Our results show that sequential activation of multiple gene markers for undifferentiated ES cells, epiblast, definitive endoderm, foregut, and pancreatic lineages was found to follow the sequence of events that mimics pancreatic ontogeny. Cells that expressed enhanced green fluorescent protein, driven by pancreatic and duodenal homeobox 1 or insulin 1 promoter, correctly expressed known beta cell lineage markers. Overexpression of Sox17, an endoderm fate-determining transcription factor, at a very early stage of differentiation (days 2-3) enhanced pancreatic gene expression. Overexpression of neurogenin3, an endocrine progenitor cell marker, induced glucagon expression at stages when pancreatic and duodenal homeobox 1 message was present (days 10-16). Forced expression (between days 16 and 25) of MafA, a pancreatic maturation factor, resulted in enhanced expression of insulin genes, glucose transporter 2 and glucokinase, and glucose-responsive insulin secretion. Day 20 cells implanted in vivo resulted in pancreatic-like cells. Together, our differentiation assay recapitulates the proceedings and behaviors of pancreatic development and will be valuable for future screening of beta cell effectors.


Figures

Fig. 1.
Fig. 1.
Kinetics studies of endogenous gene expression in our ES cell differentiation assay. (A) Protocol for differentiation of murine ES cells to pancreatic-like lineages in vitro. (B–E) R1 ES cells were differentiated and gene expression was analyzed by quantitative RT–PCR with Taqman probes. Data represent the mean and standard deviation from duplicated samples. ES, embryonic stem; PCR, polymerase chain reaction.
Fig. 1.
Fig. 1.
Kinetics studies of endogenous gene expression in our ES cell differentiation assay. (A) Protocol for differentiation of murine ES cells to pancreatic-like lineages in vitro. (B–E) R1 ES cells were differentiated and gene expression was analyzed by quantitative RT–PCR with Taqman probes. Data represent the mean and standard deviation from duplicated samples. ES, embryonic stem; PCR, polymerase chain reaction.
Fig. 2.
Fig. 2.
Flow cytometric and gene expression analyses of in vitro differentiated Pdx1- or insulin 1-expressing cells. Differentiated EGFP+ and EGFP cells, derived from Pdx1-EGFP (A) or MIP-EGFP (B) ES line, were analyzed by flow cytometry and subsequently sorted (left panels). Undifferentiated ES cells were used for negative gating of EGFP expression. Gene expression in various populations of cells was analyzed for designated markers by quantitative RT-PCR (right panels). Data represent the mean and standard deviation from duplicated samples. *Expression of the gene is different at P < 0.01, compared with presort control. Pdx1, pancreatic and duodenal homeobox 1; EGFP, enhanced green fluorescent protein. Color images available online at www.liebertonline.com/adt
Fig. 3.
Fig. 3.
Timed overexpression of Sox17, Ngn3, or MafA and their consequences in pancreatic gene activation in culture. (A) Gene expression analyzed by quantitative RT-PCR of day 20 AinV-Sox17 ES cells after doxycycline-induced expression of Sox17 between days 2 and 3 of culture. Data represent the mean and standard deviation from duplicated samples. (B) Gene expression analyzed by quantitative RT-PCR of day 20 AinV-Ngn3 ES cells after doxycycline-induced expression of Ngn3 at designated time points. (C–E) Effects of forced expression of MafA in A2lox-MafA ES cells. (C) Gene expression analyzed by quantitative RT-PCR of cultures initiated with dissociated day 16 cells that were incubated in semisolid media with designated doses of doxycycline. (D) In vitro glucose challenge assay. Data were expressed as the fold change of C-peptide concentration compared with the basal level (first low glucose incubation) in each well examined. Fold change is different between analyzed sets of samples at P < 0.01 or 0.001, as indicated. (E) As in D, average C-peptide concentrations after the first 16.7 mM d-glucose stimulation was compared between noninduced (n = 3) or MafA-induced (n = 5) cells. The error bars represent standard deviation. Ngn3, neurogenin3.
Fig. 3.
Fig. 3.
Timed overexpression of Sox17, Ngn3, or MafA and their consequences in pancreatic gene activation in culture. (A) Gene expression analyzed by quantitative RT-PCR of day 20 AinV-Sox17 ES cells after doxycycline-induced expression of Sox17 between days 2 and 3 of culture. Data represent the mean and standard deviation from duplicated samples. (B) Gene expression analyzed by quantitative RT-PCR of day 20 AinV-Ngn3 ES cells after doxycycline-induced expression of Ngn3 at designated time points. (C–E) Effects of forced expression of MafA in A2lox-MafA ES cells. (C) Gene expression analyzed by quantitative RT-PCR of cultures initiated with dissociated day 16 cells that were incubated in semisolid media with designated doses of doxycycline. (D) In vitro glucose challenge assay. Data were expressed as the fold change of C-peptide concentration compared with the basal level (first low glucose incubation) in each well examined. Fold change is different between analyzed sets of samples at P < 0.01 or 0.001, as indicated. (E) As in D, average C-peptide concentrations after the first 16.7 mM d-glucose stimulation was compared between noninduced (n = 3) or MafA-induced (n = 5) cells. The error bars represent standard deviation. Ngn3, neurogenin3.
Fig. 4.
Fig. 4.
Effects of exogenous FGF10 on Pdx1 expression. Pdx1-EGFP ES cells were differentiated. (A) Fluorescent flow cytometric analysis of Pdx1-EGFP expression after addition of designated doses of FGF10 to day 10 culture for a total of 3 days. (B) Gene expression analysis by quantitative RT-PCR. Data represent the mean and standard deviation from duplicated samples. FGF, fibroblast growth factor. Color images available online at www.liebertonline.com/adt
Fig. 5.
Fig. 5.
Further development of pancreatic-like cells in vitro and in vivo from day 20 culture. (A) R1 ES cells were differentiated for up to day 30, and cells at the designated age were analyzed by quantitative RT-PCR. Data represent the mean and standard deviation from duplicated samples. (B) MIP-EGFP ES cells were differentiated, and cells at the designated age were analyzed by flow cytometry for EGFP expression. (C–F) In vivo development of grafts at 5 weeks posttransplantation. (C) Representative clusters derived from a day 20 culture of AinV-Sox17 ES cell origin and treated with 1 μg/mL doxycycline between days 2 and 3 are shown. (D) Sections adjacent to those in C were examined by double staining for amylase (green) and insulin (red). Control slides with only secondary antibody showed negative staining (not shown). (E) Average number of acinar-like clusters, as identified by H&E staining, per square centimeter of graft area examined was determined. Data represent the mean and standard deviation from quadruplicated samples. *Number of clusters is different at P < 0.01, compared with control. (F) Double staining for C-peptide (green) and glucagon (red) from representative grafts derived from Sox17-induced cells showed single-hormone–positive cells (upper panels). H&E, hematoxylin and eosin.
Fig. 5.
Fig. 5.
Further development of pancreatic-like cells in vitro and in vivo from day 20 culture. (A) R1 ES cells were differentiated for up to day 30, and cells at the designated age were analyzed by quantitative RT-PCR. Data represent the mean and standard deviation from duplicated samples. (B) MIP-EGFP ES cells were differentiated, and cells at the designated age were analyzed by flow cytometry for EGFP expression. (C–F) In vivo development of grafts at 5 weeks posttransplantation. (C) Representative clusters derived from a day 20 culture of AinV-Sox17 ES cell origin and treated with 1 μg/mL doxycycline between days 2 and 3 are shown. (D) Sections adjacent to those in C were examined by double staining for amylase (green) and insulin (red). Control slides with only secondary antibody showed negative staining (not shown). (E) Average number of acinar-like clusters, as identified by H&E staining, per square centimeter of graft area examined was determined. Data represent the mean and standard deviation from quadruplicated samples. *Number of clusters is different at P < 0.01, compared with control. (F) Double staining for C-peptide (green) and glucagon (red) from representative grafts derived from Sox17-induced cells showed single-hormone–positive cells (upper panels). H&E, hematoxylin and eosin.
Fig. 6.
Fig. 6.
Cell stage map for our in vitro ES cell differentiation assay. Upper panel depicts stages of in vitro differentiation. The stage designation is based primarily on information obtained from kinetic studies from two murine ES cell lines in this report (Fig. 1 and Supplementary Fig. 1). Lower panel depicts stages of in vivo differentiation according to literatures. EP, epiblast; EC, ectoderm; ME, mesendoderm; DE, definitive endoderm; GT, gut tube; PE, pancreatic endoderm; PP, pancreatic progenitor; EN, endocrine; EX, exocrine; DC, duct. Color images available online at www.liebertonline.com/adt

Similar articles

Cited by

References

    1. Barbaric I. Gokhale PJ. Andrews PW. High-content screening of small compounds on human embryonic stem cells. Biochem Soc Trans. 2010;38:1046–1050. - PubMed
    1. Desbordes SC. Placantonakis DG. Ciro A. Socci ND. Lee G. Djaballah H. Studer L. High-throughput screening assay for the identification of compounds regulating self-renewal and differentiation in human embryonic stem cells. Cell Stem Cell. 2008;2:602–612. - PMC - PubMed
    1. Ding S. Wu TY. Brinker A. Peters EC. Hur W. Gray NS. Schultz PG. Synthetic small molecules that control stem cell fate. Proc Natl Acad Sci USA. 2003;100:7632–7637. - PMC - PubMed
    1. Zhu S. Wurdak H. Wang J. Lyssiotis CA. Peters EC. Cho CY. Wu X. Schultz PG. A small molecule primes embryonic stem cells for differentiation. Cell Stem Cell. 2009;4:416–426. - PubMed
    1. Barbaric I. Gokhale PJ. Jones M. Glen A. Baker D. Andrews PW. Novel regulators of stem cell fates identified by a multivariate phenotype screen of small compounds on human embryonic stem cell colonies. Stem Cell Res. 2010;5:104–119. - PubMed

Publication types

MeSH terms