. 2011 Aug 15;15(4):855-71.
doi: 10.1089/ars.2010.3629. Epub 2011 Jun 6.

Single-cell redox imaging demonstrates a distinctive response of dopaminergic neurons to oxidative insults

Affiliations

Single-cell redox imaging demonstrates a distinctive response of dopaminergic neurons to oxidative insults

Maxx P Horowitz et al. Antioxid Redox Signal. .

Abstract

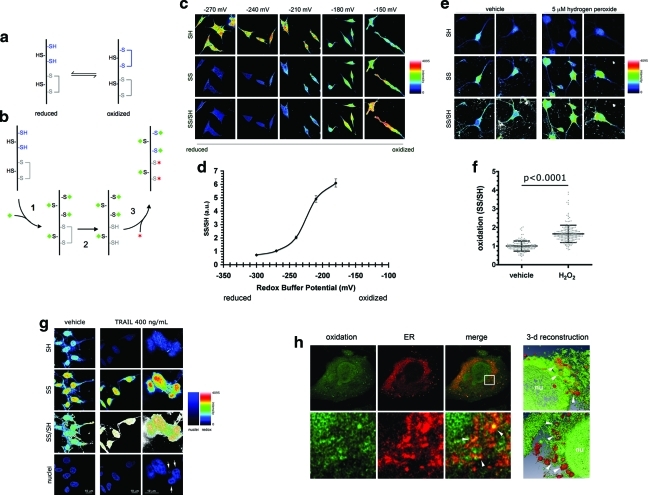
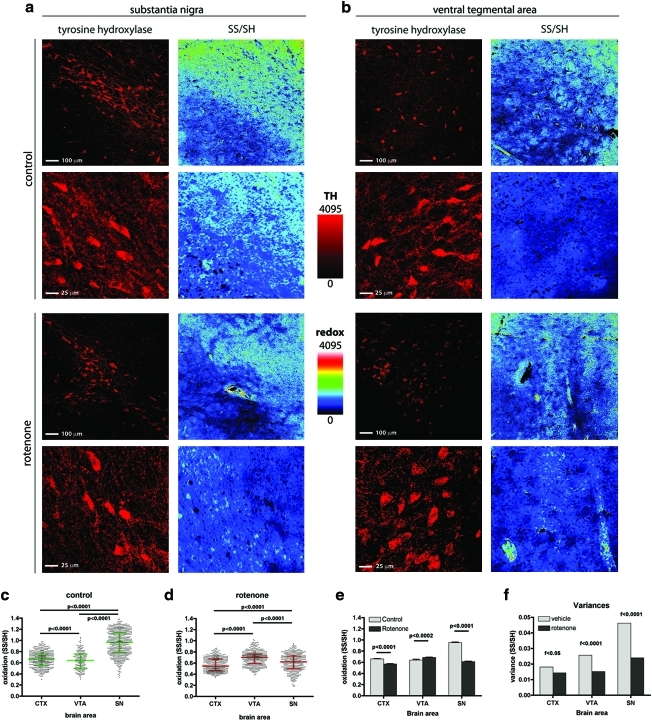
Aims: The study of the intracellular oxido-reductive (redox) state is of extreme relevance to the dopamine (DA) neurons of the substantia nigra pars compacta. These cells possess a distinct physiology intrinsically associated with elevated reactive oxygen species production, and they selectively degenerate in Parkinson's disease under oxidative stress conditions. To test the hypothesis that these cells display a unique redox response to mild, physiologically relevant oxidative insults when compared with other neuronal populations, we sought to develop a novel method for quantitatively assessing mild variations in intracellular redox state.

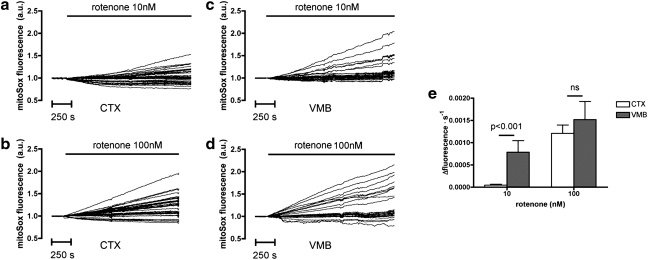
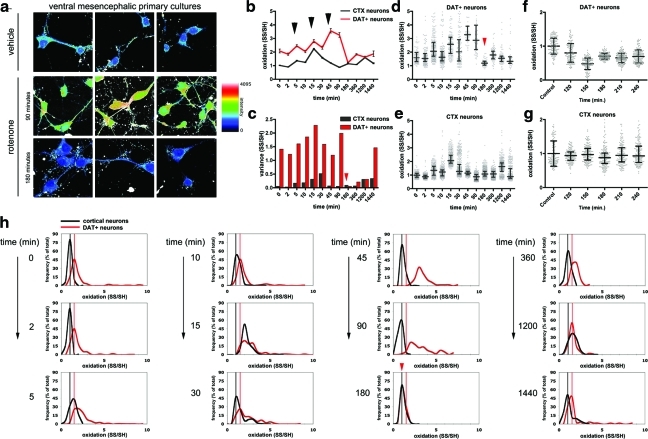
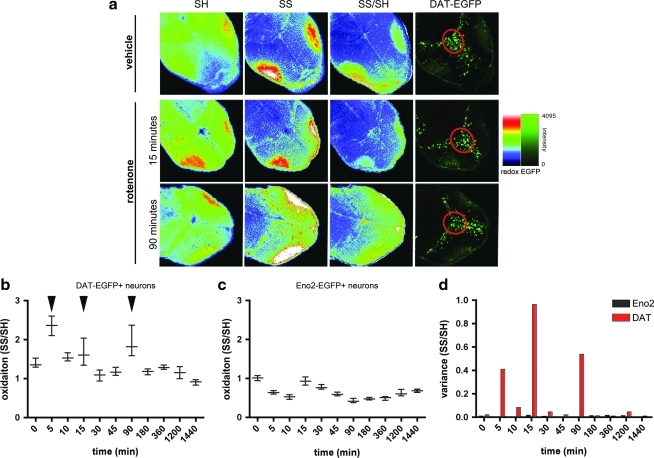
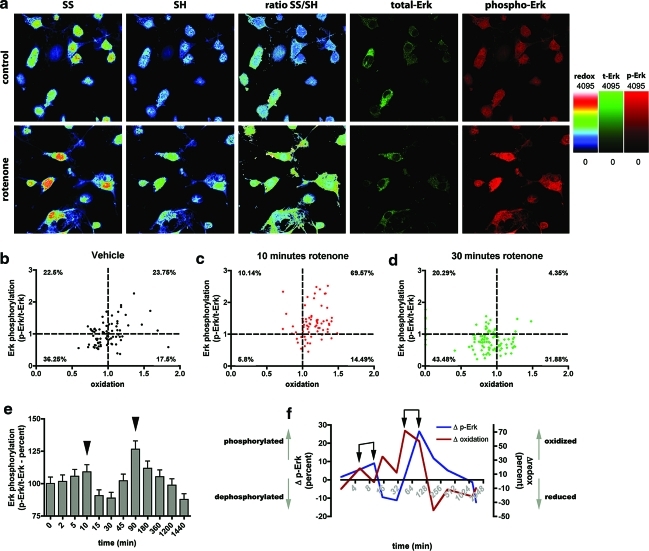
Results: We have developed a new imaging strategy to study redox variations in single cells, which is sensitive enough to detect changes within the physiological range. We studied DA neurons' physiological redox response in biological systems of increasing complexity--from primary cultures to zebrafish larvae, to mammalian brains-and identified a redox response that is distinctive for substantia nigra pars compacta DA neurons. We studied simultaneously, and in the same cells, redox state and signaling activation and found that these phenomena are synchronized.

Innovation: The redox histochemistry method we have developed allows for sensitive quantification of intracellular redox state in situ. As this method is compatible with traditional immunohistochemical techniques, it can be applied to diverse settings to investigate, in theory, any cell type of interest.

Conclusion: Although the technique we have developed is of general interest, these findings provide insights into the biology of DA neurons in health and disease and may have implications for therapeutic intervention.


Figures

FIG. 1.
FIG. 1.
Validation of the redox histochemistry method. (a) Schematic of the equilibrium between reduced (left) and oxidized (right) thiol-containing chemical species in the cellular environment. The equilibrium will shift toward one or the other of the species depending upon the physiological or pathophysiological state of the cell (27). Only certain thiols are redox sensitive (depicted in blue); other thiols are always present in a reduced (black) or in an oxidized (gray) form, and are not involved in redox regulation. (b) Schematic describing the strategy used to perform the differential labeling of oxidized and reduced thiols for redox immunohistochemistry (RHC). In the initial step, thiols in the reduced form are labeled with the first maleimide-conjugated dye (shown in green). In the second step, thiols are released from oxidized disulfides using the reducing agent tris(2-carboxyethyl)phosphine (TCEP), whose chemistry interferes minimally with the maleimide-thiol reaction. In the final step, the newly formed reduced thiols are labeled with a second maleimide-conjugated dye (shown in red). (c) Differential labeling of total thiols senses artificially induced changes in the redox state. SH-SY5Y cells were fixed in solutions of known redox potential (Eh), obtained by mixing the redox couple glutathione (GSH)/oxidized glutathione (GSSG) in different proportions. As the conditions are set at less negative, that is, more oxidizing Eh values, a decrease in the signal of reduced thiols (SH) is paralleled by an increase in the signal of the oxidized thiols (SS). As expected, the ratio signal SS/SH increases with oxidation. (d) Quantitative analysis of the imaging data indicates that the approach can detect variations in a wide range Eh values, including physiological Eh values. (e) Exposure of primary mesencephalic neurons to 5 μM hydrogen peroxide induces detectable variations in the total thiols redox state (t-test, p<0.0001). (f) Quantitative analysis of the imaging data indicates that hydrogen peroxide exposure causes a significant increase in oxidation. In the scatter plot graph, each point corresponds to a different region of interest localized in the cytosol of a neuron. (g) Detection of intracellular oxidation as a consequence of apoptosis induced by the TNF-related apoptosis-inducing ligand (TRAIL). Exposure to TRAIL for 16 h induces apoptotic fragmentation of nuclei (arrows) and is accompanied by a remarkable increase in the intracellular redox state. (h) RHC detects areas of higher oxidation at the subcellular level. 4Pi microscopy was performed on cells expressing ER-targeted RFP (red) and prepared for RHC to label only the oxidized disulfides (green). Yellow colocalization indicates ER areas with higher oxidation. Lower panel depicts a zoom of the area enclosed in the white square in which oxidation signal appears as a heterogeneous network overlapping with ER (arrowheads). The right portion of the panel depicts two different three-dimensional reconstructions of oxidation (green) in ER-labeled (red) cells. Arrowheads point to areas in which oxidation and ER overlap. In these images empty portions represent reduced areas. nu, nucleus. (To see this illustration in color the reader is referred to the web version of this article at www.liebertonline.com/ars).
FIG. 2.
FIG. 2.
Real-time measurement of rotenone-induced superoxide production in neurons using the MitoSox probe. (a–d) Representative traces of individual neurons showing changes in MitoSox fluorescence following rotenone administration. The signal is normalized with baseline fluorescence detected before rotenone application. In the studied time frame (30 min) the increment in fluorescence is linear, and, as expected, administration of higher concentrations of rotenone (100 nM) induces a more robust increment in the MitoSox signal. (e) Bar graph showing the average rate of increment in MitoSox fluorescence. Treatment with 10 nM rotenone induces a significantly higher rate of reactive oxygen species production in ventral mesencephalic (VM) cultures (left bars). The trend is also observed when cells are treated with 100 nM rotenone, even though statistical significance is not reached. ns, not significant.
FIG. 3.
FIG. 3.
Rotenone induces different redox response in primary midbrain dopaminergic neurons versus primary cortical neurons. (a) Representative images of primary rat mesencephalic cultures stained for oxidized and reduced thiols. The montage depicts the ratio SS/SH in neurons treated with vehicle or with 10 nM rotenone for 90 and 180 min, which represent a peak of oxidation and the clamped reduced state, respectively. In the scale, more oxidized states are shown in red, whereas less oxidized states are shown in blue. While a significant increase in oxidation is detected after 90 min, at the 180 min time-point the cellular redox state is in a relatively reduced state. (b) Comparison of the variations in redox state between dopamine transporter-positive (DAT+) neurons and cortical neurons in response to 10 nM rotenone treatment. Black arrowheads indicate the peaks of oxidation. Data represent the mean with standard error of the mean. Differences (except for the 180 and 1200 min time-points) are statistically significant when analyzed with Kruskal-Wallis test (p<0.0001), followed by Dunn's post-test (p<0.001). (c) Graph of the variances observed during rotenone treatment in DAT+ and cortical neurons. The clamped, reduced state observed in DAT+ neurons is indicated by the red arrowhead. (d, e) The scatter plots, in which each dot represents a different neuron, reveal that DAT+ neurons have a wider redox state spread over much of the course of rotenone treatment. Medians with the interquartile range are superimposed on the scatter plots. The clamped, reduced state observed in DAT+ neurons is indicated by the red arrowhead. Variances are significantly different (p<0.001, Kruskal-Wallis test, followed by a Dunn's multiple comparison test). (f, g) Time points around 180 min, during which DAT+ neurons are in a reduced state, were analyzed in greater detail. In the graphs, means with standard deviation are superimposed on the scatter plots. In DAT+ neurons, a reduced state is observable after 120 min of treatment, as indicated by the mean and the standard deviation values, respectively. A minimum in SS/SH values is observed at 150 min, and a minimum in variance is observed after 180 min. No significant differences are observed in cortical neurons. (h) Frequency distribution graphs as a function of cellular redox state. As a reference, the value of the redox state possessed by the majority of neurons in untreated cultures is marked with gray (cortical) or black (DAT+) lines parallel to the y-axes. Shorter and wider curves indicate a heterogeneous redox state in the population of cells, whereas taller and narrower curves indicate homogeneous redox state. The rotenone-induced oxidation is more profound in DAT+ neurons, as indicated by the more pronounced changes in the frequency distribution. The red arrowhead indicates the narrow and tall peak observed during the reduced, clamped state (180 min). (To see this illustration in color the reader is referred to the web version of this article at www.liebertonline.com/ars).
FIG. 4.
FIG. 4.
Redox time course in zebrafish embryo neurons treated with rotenone mirrors the findings in primary cultures. (a) Representative images of Tg(slc6a3[11kb]:egfp) transgenic zebrafish larvae stained for oxidized and reduced thiols. The image shows the oxidation levels in vehicle-treated larvae, and at two time points after rotenone treatment, when a peak of oxidation was detected. The pretectal nucleus of dopaminergic neurons (circled in red) was identified at the anterior end of the GFP+ cluster, and was used to delineate the region of interest in which the signal of the reduced and oxidized thiols was measured. (b) Time-course analysis of the variation of DA neurons' redox state following administration of 10 nM rotenone. The pattern is multiphasic, with three peaks of oxidation (black arrowheads). At the 180 min time point DA neurons are in a clamped, reduced state. Data are plotted as median with the interquartile range. (c) The fluctuations in the redox state in nondopaminergic neurons are less pronounced, with a single peak of oxidation at the 15 min time-point. Data are plotted as median with the interquartile range. In (b) and (c) medians are significantly different (p<0.001, Kruskal-Wallis test, followed by a Dunn's multiple comparison test). (d) The variance of the redox state in DA neurons is significantly higher than in non-DA neurons (p<0.001). At the time-points when oxidation peaks, the variance of DA neurons redox state is remarkably high. (To see this illustration in color the reader is referred to the web version of this article at www.liebertonline.com/ars).
FIG. 5.
FIG. 5.
Rotenone induces region-specific alterations in neuronal redox state in the rat brain. Representative images of RHC applied to rat brain sections containing the substantia nigra pars compacta (SNpc) (a) or the ventral tegmental area (VTA) (b). The sections were counterstained for tyrosine hydroxylase (TH) to identify DA neurons. (c) Intracellular redox state of TH+ neurons in vehicle-treated rats. The basal intracellular redox state of DA neurons in the SNpc is more oxidized than that of DA neurons of the VTA or cortical neurons. (d) Intracellular redox state in rotenone-treated rats. (e) Direct comparison of the redox state levels in tissues from vehicle- (gray bars) or rotenone-treated (black bars) animals. Rotenone induces a robust response in DA neurons in the SNpc, which results in a more reduced intracellular redox state. DA neurons of the VTA, and cortical neurons react to a smaller extent. (f) Rotenone administration induces a decrease in the variance of the redox state values, which is analogous to the redox clamping observed in primary mesencephalic neurons, and zebrafish larvae. The magnitude of variance reduction is greater in the DA neurons of the SNpc. The decreased spread in redox state is also notable in the scatter plots (c, d), in which each dot represents an individual neuron. Variances are significantly different (p<0.001). (To see this illustration in color the reader is referred to the web version of this article at www.liebertonline.com/ars).
FIG. 6.
FIG. 6.
Time-dependent variation in cellular redox state correlates with variations in ERK signaling. (a) Representative images of RHC applied in combination with phosphorylated extracellular signal-regulated kinases 1/2 (p-Erk1/2) and total Erk1/2 (t-Erk1/2) labeling in VM primary cultures. Rotenone induces an increase in oxidation—as indicated by the SS/SH ratio—as well as an increase in p-Erk1/2 (red channel). (b–d) Scatter plot graphs show that p-Erk1/2 levels correlate with the intracellular redox state. The dashed lines mark the mean values of the redox state (vertical) and of Erk1/2 phosphorylation (horizontal) in the vehicle-treated sample, and define four quadrants in the plot. The graphs depict that rotenone treatment induces simultaneous variations in p-Erk1/2 and the redox state. (c) Ten minutes of rotenone administration induces increases in p-Erk1/2 and in oxidation (69.57% of the cells are in the top-right quadrant). (d) After 30 min, the majority of the cells are in a reduced state, with low levels of p-Erk1/2 (43.48% of the cells in the bottom-left quadrant). (e) Time-course analysis in primary rat VM neurons indicates that rotenone induction of Erk1/2 phosphorylation is multiphasic, with peaks at 10 and 90 min (arrowheads). (f) Variations in p-Erk1/2 and intracellular redox state during rotenone treatment in primary rat VM neurons. The control is set equal to zero in both cases, and the graph represents variations as percent of control during the treatment. Peaks in oxidation (red line) precede those in p-Erk1/2 (blue line), SD is indicated by the pairs of black arrows. Means are significantly different (p<0.001). (To see this illustration in color the reader is referred to the web version of this article at www.liebertonline.com/ars).

Similar articles

Cited by

References

    1. Adimora NJ. Jones DP. Kemp ML. A model of redox kinetics implicates the thiol proteome in cellular hydrogen peroxide responses. Antioxid Redox Signal. 2010;13:731–743. - PMC - PubMed
    1. Alam M. Schmidt WJ. Rotenone destroys dopaminergic neurons and induces parkinsonian symptoms in rats. Behav Brain Res. 2002;136:317–324. - PubMed
    1. Anantharam V. Lehrmann E. Kanthasamy A. Yang Y. Banerjee P. Becker KG. Freed WJ. Kanthasamy AG. Microarray analysis of oxidative stress regulated genes in mesencephalic dopaminergic neuronal cells: relevance to oxidative damage in Parkinson's disease. Neurochem Int. 2007;50:834–847. - PMC - PubMed
    1. Antunes F. Cadenas E. Estimation of H2O2 gradients across biomembranes. FEBS Lett. 2000;475:121–126. - PubMed
    1. Avshalumov MV. Chen BT. Koós T. Tepper JM. Rice ME. Endogenous hydrogen peroxide regulates the excitability of midbrain dopamine neurons via ATP-sensitive potassium channels. J Neurosci. 2005;25:4222–4231. - PMC - PubMed

Publication types

LinkOut - more resources