. 2011 Jun 1;56(3):1072-81.
doi: 10.1016/j.neuroimage.2011.02.072. Epub 2011 Mar 17.

Controlling false positive rates in mass-multivariate tests for electromagnetic responses

Affiliations

Controlling false positive rates in mass-multivariate tests for electromagnetic responses

Gareth R Barnes et al. Neuroimage. .

Abstract

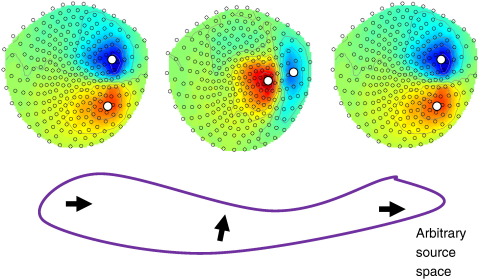
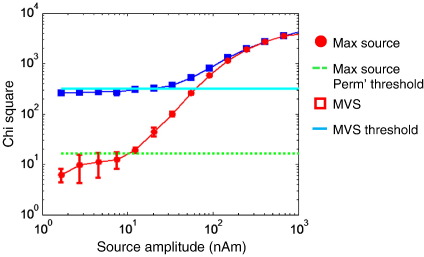
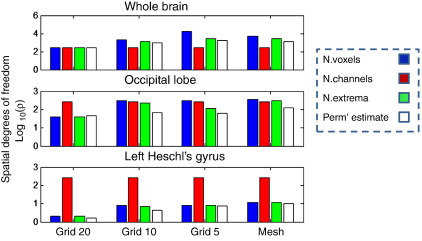
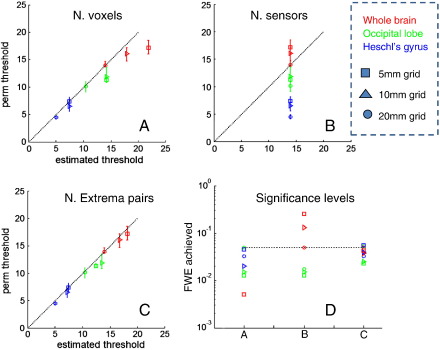
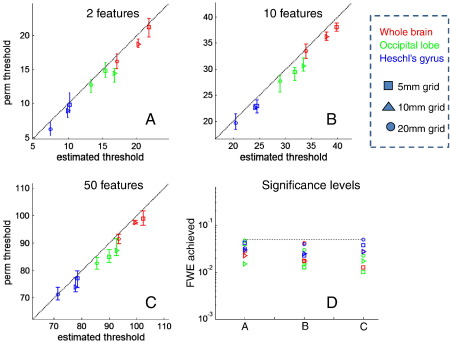
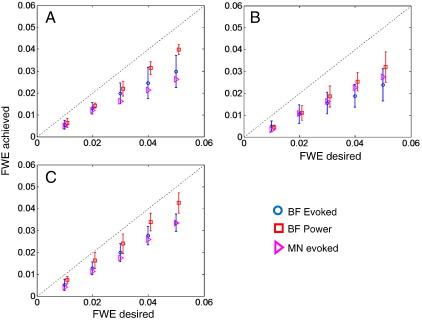
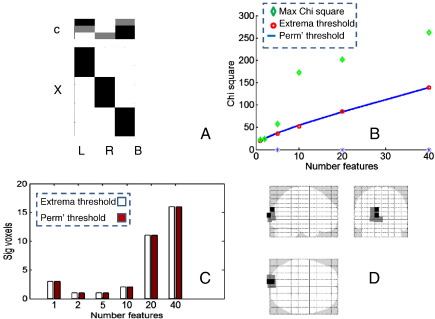
We address the problem of controlling false positive rates in mass-multivariate tests for electromagnetic responses in compact regions of source space. We show that mass-univariate thresholds based on sensor level multivariate thresholds (approximated using Roy's union-intersection principle) are unduly conservative. We then consider a Bonferroni correction for source level tests based on the number of unique lead-field extrema. For a given source space, the sensor indices corresponding to the maxima and minima (for each dipolar lead field) are listed, and the number of unique extrema is given by the number of unique pairs in this list. Using a multivariate beamformer formulation, we validate this heuristic against empirical permutation thresholds for mass-univariate and mass-multivariate tests (of induced and evoked responses) for a variety of source spaces, using simulated and real data. We also show that the same approximations hold when dealing with a cortical manifold (rather than a volume) and for mass-multivariate minimum norm solutions. We demonstrate that the mass-multivariate framework is not restricted to tests on a single contrast of effects (cf, Roy's maximum root) but also accommodates multivariate effects (cf, Wilk's lambda).


Figures

Fig. 1
Fig. 1
Example of the extremal heuristic. Three dipoles in an arbitary source space are considered. If this space is small in relation to the distance from the sensors then the left-most and right-most sources will have essentially identical lead fields, as they share the same orientation. Whereas the central source is distinct. The extremal heuristic in this case will be two (as there are only 2 unique extremal pairs) even though there are three sources in the space (and, in the random field context, all neighbours will have uncorrelated residuals).
Fig. 2
Fig. 2
Comparison of sensor and maximum source level χ2 statistics from a ROI containing a single dipolar source of increasing amplitude: The simulated source was present in 500 of 1000 trials and comprised a sinusoid driven at 40 Hz for 200 ms. Source and sensor level tests are both based on the amplitude of the real Fourier component in the 40 Hz bin, comparing the active to passive trials. Blue squares show the multivariate sensor (MVS) level test statistic alongside the analytic sensor level threshold (cyan solid) for this test (for 1 feature, and 274 sensors this statistic has a χ2 (274–1) null distribution). The red circles show the maximum χ2 value from across the source space (1 cm grid) and the source level threshold (green dotted) shows the corrected p = 0.05 threshold level for the maximum χ2 statistic based on null distribution from 400 permutations. As all these tests consider a single data-feature, the source level χ2 test is equivalent to an F test and the sensory level multivariate χ2 is equivalent to the Roy's maximum root or Hotelling's T squared test. Note that the sensor level threshold (cyan solid) is an upper bound on the mass-univariate threshold (green dotted). Importantly, the source level statistic crosses the source level permutation threshold long before it crosses the threshold based on the multivariate test. That is, the multivariate sensor level threshold is a valid but rather conservative threshold for mass-univariate source level tests.
Fig. 3
Fig. 3
Estimates of the number of independent sources ρ based on the original number of sources (blue bars), the sensor count (red), and number of unique extrema (green) for three different regions of interest. Also shown (white bars) are the effective number of sources (or ideal ρ) estimated based on the Bonferroni correction required to give the desired family wise error rate in the univariate evoked response case (see next figure). Note the ordinates are logarithmic so a difference of 1.0 is equivalent to an order of magnitude. The source spaces considered here used different grid densities, where 5, 10, and 20 refer to regular lattice source spaces of 5, 10, and 20 mm spacings; mesh refers to a canonical cortical mesh of 5124 vertices. Note that the best predictors of ideal ρ are the total number of sources (blue) and the number of unique extrema (green), and for small (resp. coarse) source spaces these two metrics are approximately the same, but as the source space becomes larger (resp. finer) the extremal measure increases relatively slowly.
Fig. 4
Fig. 4
A comparison of analytical thresholds for a mass-univariate test based on three different estimates of the number of independent sources for a family wise error rate of 5%. The three estimates are the total number of sources (A), the number of sensors (B) and the number of unique extremal pairs (C). Different symbols represent different grid spacing (circles, 20 mm, triangles 10 mm, and squares 5 mm) and different colours represent different regions of interest (red whole brain, green occipital lobe, and blue Heschl's gyrus). The dotted lines show the ideal (exact) match between permutation and analytical thresholds, and points below this line indicate that analytical thresholds give conservative (larger) thresholds than required by permutation testing. The false positive rate (assuming that all sources are independent) is, as one would expect, always conservative but becomes more accurate as the number of sources decreases. The assumption that there are as many independent sources as there are sensors (B) gives inexact thresholds, which are generally conservative for smaller regions of interest (blue) and too liberal for larger ROIs (red). In panel C, the number of independent sources is based on the unique extremal heuristic, which provides efficient thresholds across all grid spacing and regions of interest. Panel D shows the actual and desired (dotted) error rates for each sort of threshold reported in panels A, B and C.
Fig. 5
Fig. 5
A comparison of mass-multivariate thresholds using the unique extrema for v = 2 (A), 10 (B), and 50(C) data features. This figure uses the same notation for grid spacing (symbols) and ROIs (colours) as in Fig. 3. Panel D shows the actual and desired (dotted) error rates for each of the tests reported in panels A, B, and C. This estimate of the number of unique sources furnishes good, although mildly conservative, mass-multivariate thresholds.
Fig. 6
Fig. 6
The desired vs. actual (permutation) false positive rates, collapsing results from all feature numbers (1, 2, 5, 10, 20, and 50) and grid spacing for tests on evoked (blue circles) and induced (red squares) responses for whole brain (A), occipital (B) and Heschl's gyrus (C) ROIs. The error bars show the standard deviation. Note that the tests of power seem to be less conservative than those of evoked responses. The purple triangles are the false positive rates when applying the same heuristic to the mass-multivariate minimum norm scheme (Soto et al., 2009) reconstructed on the canonical mesh.
Fig. 7
Fig. 7
Application of the scheme to test for differences between gamma spectra due to two gratings of different orientations and a pre-stimulus baseline period (Duncan et al., 2010). Panel A shows the design (lower) and contrast matrices (top); there are 3 conditions (left oblique, right oblique, and blank) and we wish to test for differences between all three conditions (color scale is black, midgrey, and white for − 1, 0,+1 respectively). Panel B shows the maximum source level statistic (green diamonds), the analytical threshold based on the unique extremal heuristic (blue solid) and the permutation thresholds for the volume (red circles) for different numbers of spectral features (i.e., principal eigenmodes). Note that the analytical and empirical thresholds accord well, and panel C shows the agreement between the numbers of voxels deemed significant using both thresholds (permutation solid). Stars on the abscissa (in B) indicate that the dimensionality of the alternate hypothesis was more than one. D shows the glass brain image for the (FWE corrected) significant voxels (grey) for mass-multivariate tests on 20 spectral features (eigenmodes). Those voxels where 2 dimensions were required to explain the alternative hypothesis are shown in darker grey; that is, at these sources the differences between gamma spectra cannot simply be explained by a scaled difference along one dimension (for example left oblique > right oblique > baseline) but must be due to distinct spectral responses to left and right oblique gratings.

References

    1. Barnes G.R., Hillebrand A. Statistical flattening of MEG beamformer images. Hum. Brain Mapp. 2003;18:1–12. - PMC - PubMed
    1. Brookes M.J., Gibson A.M., Hall S.D., Furlong P.L., Barnes G.R., Hillebrand A., Singh K.D., Holliday I.E., Francis S.T., Morris P.G. GLM-beamformer method demonstrates stationary field, alpha ERD and gamma ERS co-localisation with fMRI BOLD response in visual cortex. Neuroimage. 2005;26:302–308. - PubMed
    1. Brookes M.J., Vrba J., Robinson S.E., Stevenson C.M., Peters A.M., Barnes G.R., Hillebrand A., Morris P.G. Optimising experimental design for MEG beamformer imaging. Neuroimage. 2008;39:1788–1802. - PubMed
    1. Canolty R.T., Edwards E., Dalal S.S., Soltani M., Nagarajan S.S., Kirsch H.E., Berger M.S., Barbaro N.M., Knight R.T. High gamma power is phase-locked to theta oscillations in human neocortex. Science. 2006;313:1626–1628. - PMC - PubMed
    1. Carbonell F., Galan L., Valdes P., Worsley K., Biscay R.J., az-Comas L., Bobes M.A., Parra M. Random field–union intersection tests for EEG/MEG imaging. Neuroimage. 2004;22:268–276. - PubMed

Publication types

MeSH terms

LinkOut - more resources