

Noninvasive imaging of three-dimensional cardiac activation sequence during pacing and ventricular tachycardia
- PMID: 21397046
- PMCID: PMC3151469
- DOI: 10.1016/j.hrthm.2011.03.014
Noninvasive imaging of three-dimensional cardiac activation sequence during pacing and ventricular tachycardia
Abstract
Background: Imaging cardiac excitation within ventricular myocardium is important in the treatment of cardiac arrhythmias and might help improve our understanding of arrhythmia mechanisms.
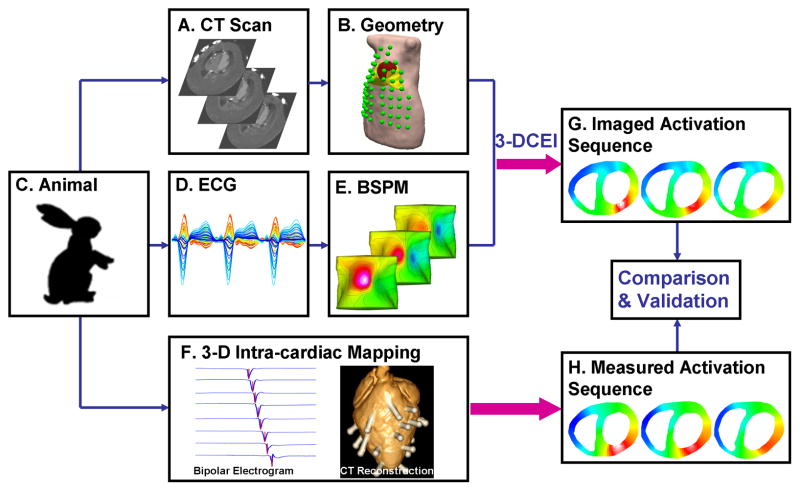
Objective: This study sought to rigorously assess the imaging performance of a 3-dimensional (3D) cardiac electrical imaging (3DCEI) technique with the aid of 3D intracardiac mapping from up to 216 intramural sites during paced rhythm and norepinephrine (NE)-induced ventricular tachycardia (VT) in the rabbit heart.
Methods: Body surface potentials and intramural bipolar electrical recordings were simultaneously measured in a closed-chest condition in 13 healthy rabbits. Single-site pacing and dual-site pacing were performed from ventricular walls and septum. VTs and premature ventricular complexes (PVCs) were induced by intravenous NE. Computed tomography images were obtained to construct geometry models.
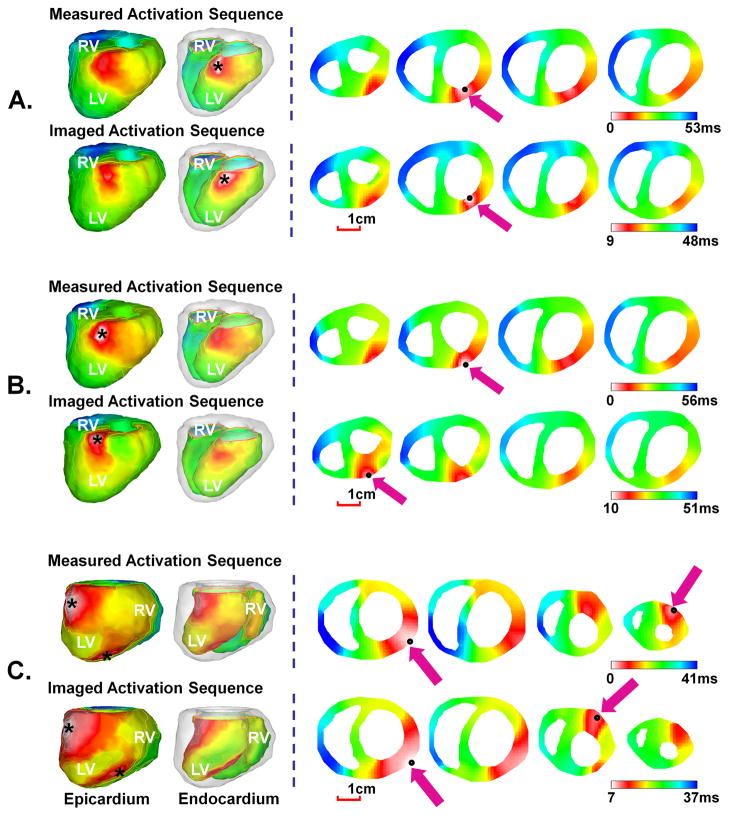
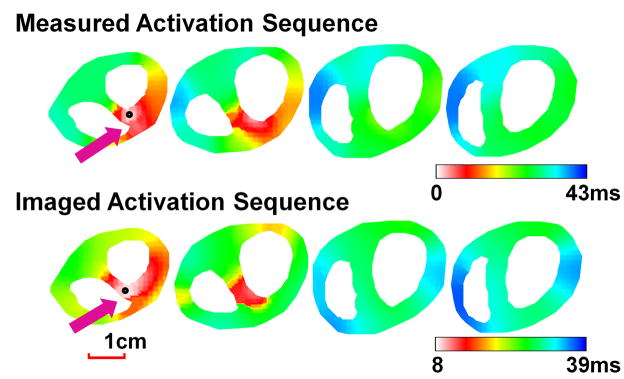
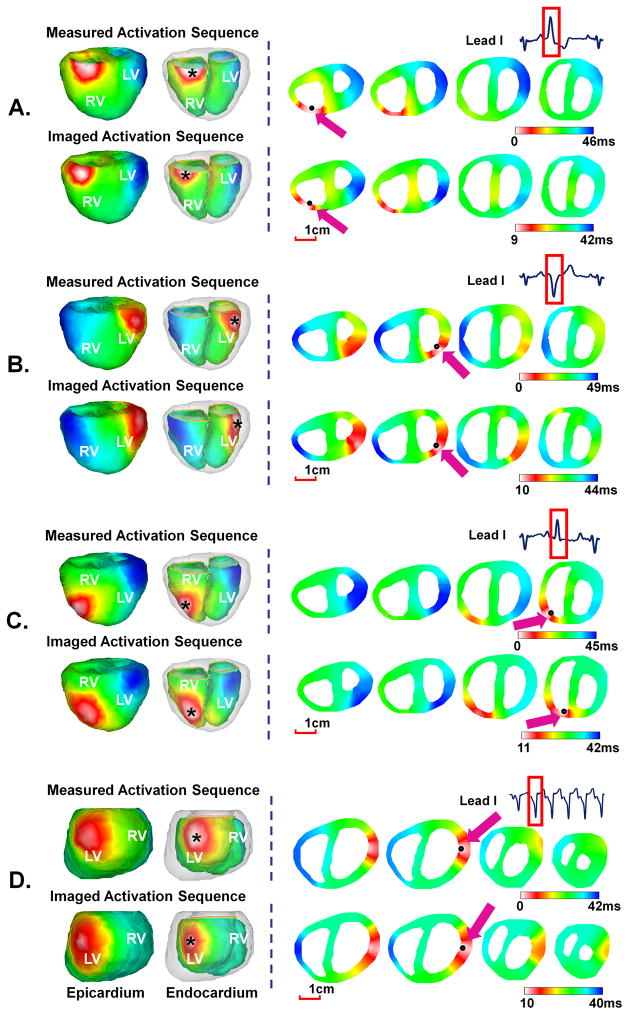
Results: The noninvasively imaged activation sequence correlated well with invasively measured counterpart, with a correlation coefficient of 0.72 ± 0.04, and a relative error of 0.30 ± 0.02 averaged over 520 paced beats as well as 73 NE-induced PVCs and VT beats. All PVCs and VT beats initiated in the subendocardium by a nonreentrant mechanism. The averaged distance from the imaged site of initial activation to the pacing site or site of arrhythmias determined from intracardiac mapping was ∼5 mm. For dual-site pacing, the double origins were identified when they were located at contralateral sides of ventricles or at the lateral wall and the apex.
Conclusion: 3DCEI can noninvasively delineate important features of focal or multifocal ventricular excitation. It offers the potential to aid in localizing the origins and imaging activation sequences of ventricular arrhythmias, and to provide noninvasive assessment of the underlying arrhythmia mechanisms.
Copyright © 2011 Heart Rhythm Society. Published by Elsevier Inc. All rights reserved.
Conflict of interest statement
Figures
References
-
- Morady F. Radio-frequency ablation as treatment for cardiac arrhythmias. N Engl J Med. 1999;340:534–544. - PubMed
-
- Dong J, Calkins H, Solomon SB, et al. Integrated electroanatomic mapping with three-dimensional computed tomographic images for real-time guided ablations. Circulation. 2006;113:186–194. - PubMed
-
- Okamoto Y, Teramachi Y, Musha T. Limitation of the inverse problem in body surface potential mapping. IEEE Trans Biomed Eng. 1983;30:749–754. - PubMed
-
- Gulrajani RM, Roberge FA, Savard P. Moving dipole inverse ECG and EEG solutions. IEEE Trans Biomed Eng. 1984;31:903–910. - PubMed
-
- Mirvis DM, Keller FW, Ideker RE, Cox JW, Jr, Dowdie RF, Zettergren DG. Detection and localization of multiple epicardial electrical generators by a two-dipole ranging technique. Circ Res. 1977;41:551–557. - PubMed
Publication types
MeSH terms
Substances
Grants and funding
LinkOut - more resources
Full Text Sources
Miscellaneous
