. 2011 Mar 11;88(3):333-43.
doi: 10.1016/j.ajhg.2011.02.005.

CNNM2, encoding a basolateral protein required for renal Mg2+ handling, is mutated in dominant hypomagnesemia

Affiliations

CNNM2, encoding a basolateral protein required for renal Mg2+ handling, is mutated in dominant hypomagnesemia

Marchel Stuiver et al. Am J Hum Genet. .

Abstract

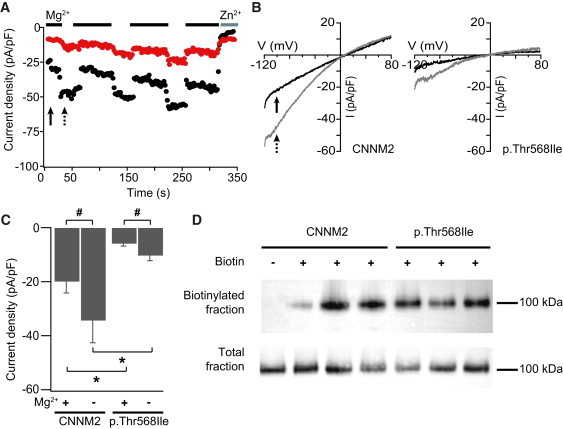
Familial hypomagnesemia is a rare human disorder caused by renal or intestinal magnesium (Mg(2+)) wasting, which may lead to symptoms of Mg(2+) depletion such as tetany, seizures, and cardiac arrhythmias. Our knowledge of the physiology of Mg(2+) (re)absorption, particularly the luminal uptake of Mg(2+) along the nephron, has benefitted from positional cloning approaches in families with Mg(2+) reabsorption disorders; however, basolateral Mg(2+) transport and its regulation are still poorly understood. Here, by using a candidate screening approach, we identified CNNM2 as a gene involved in renal Mg(2+) handling in patients of two unrelated families with unexplained dominant hypomagnesemia. In the kidney, CNNM2 was predominantly found along the basolateral membrane of distal tubular segments involved in Mg(2+) reabsorption. The basolateral localization of endogenous and recombinant CNNM2 was confirmed in epithelial kidney cell lines. Electrophysiological analysis showed that CNNM2 mediated Mg(2+)-sensitive Na(+) currents that were significantly diminished in mutant protein and were blocked by increased extracellular Mg(2+) concentrations. Our data support the findings of a recent genome-wide association study showing the CNNM2 locus to be associated with serum Mg(2+) concentrations. The mutations found in CNNM2, its observed sensitivity to extracellular Mg(2+), and its basolateral localization signify a critical role for CNNM2 in epithelial Mg(2+) transport.


Figures

Figure 1
Figure 1
Pedigrees of Families and CNNM2 Mutations (A) Pedigrees of families A (left) and B (right) and partial electropherograms of CNNM2 of the index patients. Filled symbols represent affected individuals and index patients are indicated with a “P” and arrow. In the electropherograms, the mutations are indicated by an arrow and the nucleotide changes and resulting effect on the protein are shown. (B) Localization of the mutations in the predicted secondary structure of CNNM2. The predicted transmembrane domains are indicated in green and the CBS domains in pink. The ancient conserved domain is boxed and the mutations are indicated with an asterisk. (C) Conservation of human CNNM2 Thr568 in CNNM family members and in orthologs from mammals to bacteria. The amino acid sequence of human CNNM2 (in bold) is aligned with its three human family members and six orthologs around Thr568 (boxed in red). The upper ruler refers to the human CNNM2 amino acid positions. Conservation is shown below the sequences, following ClustalW convention (asterisk, invariant; colon, highly similar).
Figure 2
Figure 2
Immunohistochemical Analysis of CNNM2 in Human Kidney (A) Staining of a human kidney section with antibodies against UMOD (left, in green) and CNNM2 (middle, in red). The merged image on the right shows codistribution of UMOD and CNNM2 in identical nephron segments, indicating basolateral subcellular staining of CNNM2 in the TAL. The scale bars represent 50 μm. (B) Immunostaining for PVALB (left, in green) and CNNM2 (middle, in red) of a human kidney section. The merged image on the right indicates codistribution of PVALB in the DCT with basolaterally localized CNNM2. The scale bars represent 50 μm. (C) A human kidney section stained with antibodies against NCC (left, in red) and CNNM2 (middle, in green). Merging the images as shown on the right shows that all NCC positive tubules are positive for CNNM2, indicating the presence of CNNM2 in the DCT. The scale bars represent 50 μm.
Figure 3
Figure 3
Response to Extracellular Mg2+ and Basolateral Localization of CNNM2 in Cultured Cells (A) Modulation of Cnnm2, Trpm6, and Slc12a3 mRNA levels under low-Mg2+ or low-Ca2+ conditions. mDCT cells showed increased expression levels of Cnnm2 (in red) and Trpm6 (in blue) after 18 hr growth under low-Mg2+ (left bars) but not under low-Ca2+ conditions (right bars) as determined by quantitative real-time PCR. The Slc12a3 transcript (Ncc, in yellow) was used as a positive control for low-Ca2+ conditions. Expression levels are normalized to those of Gapdh and shown as fold change difference compared to control conditions. n = 6, data are shown as means ± SEM. ∗∗p < 0.01; ∗∗∗p < 0.001 compared to normal culture conditions. (B) Effect of low Mg2+ on endogenous CNNM2 protein levels in polarized mDCT cells as shown by immunolabeling with antibodies against CNNM2 (in red). After 18 hr growth under low-Mg2+ conditions, mDCT cells showed increased CNNM2 expression (bottom left) when compared to control conditions (top left) with identical recording settings. Predominant basolateral staining was observed in Z stacks for both control (top right) and low-Mg2+ conditions (bottom right). The scale bars represent 20 μm (left) and 5 μm (right). (C) Confocal images of transiently transfected MDCK-C7 cells with wild-type (left) and p.Thr568Ile mutant (right) CNNM2-HA-tagged constructs. Cells were immunostained with antibodies against the HA tag (in green) and costained with antibodies against the tight junction protein occludin (in red) as a boundary marker between the apical and basolateral compartment. Nuclei were counterstained with DAPI (in blue). Wild-type and p.Thr568Ile mutant CNNM2 showed comparable localization to the (baso-) lateral membrane. The scale bars represent 10 μm.
Figure 4
Figure 4
Electrophysiological Analysis of Wild-Type and p.Thr568Ile Mutant CNNM2 (A) Representative whole-cell current densities measured from HEK293 cells transiently transfected with expression constructs for wild-type CNNM2 (black dots) or p.Thr568Ile mutant CNNM2 (red dots). Current traces were recorded in a bath solution containing either 20 mM MgSO4, (indicated by black bars above the graph) or 20 mM ZnSO4 (gray bar) or in a Mg2+- and Zn2+-free bath solution (no bars). The solid and dotted arrows correspond to the time point of measurement in the presence or absence of extracellular Mg2+, the results of which are shown in (B) and (C). (B) Representative I-V relationship traces recorded either in the presence (solid arrow, traces in black) or absence of extracellular Mg2+ (dotted arrow, traces in gray). p.Thr568Ile mutant Na+-evoked currents (right) were smaller under both perfusion conditions as compared to the wild-type CNNM2 protein (left). (C) Histogram presenting averaged current densities at −110 mV obtained from wild-type (left) and p.Thr568Ile mutant CNNM2 (right) expressing HEK293 cells (n = 16 for both) in the presence and absence of 20 mM extracellular MgSO4 (indicated by a + or a − symbol). Under both conditions, current amplitudes in cells expressing mutant CNNM2 were significantly smaller than those in cells expressing wild-type CNNM2. p < 0.05, compared to wild-type CNNM2. #p < 0.05, compared to presence of 20 mM Mg2+. The error bars denote SEM. (D) Cell surface biotinylation of HEK293 cells expressing HA-tagged wild-type or p.Thr568Ile mutant CNNM2. A representative immunoblot shows comparable expression levels of mutant and wild-type protein on the membrane (upper blot) as well as in the total protein fraction (lower blot).

References

    1. Quamme G.A. Renal magnesium handling: New insights in understanding old problems. Kidney Int. 1997;52:1180–1195. - PubMed
    1. Simon D.B., Lu Y., Choate K.A., Velazquez H., Al-Sabban E., Praga M., Casari G., Bettinelli A., Colussi G., Rodriguez-Soriano J. Paracellin-1, a renal tight junction protein required for paracellular Mg2+ resorption. Science. 1999;285:103–106. - PubMed
    1. Konrad M., Schaller A., Seelow D., Pandey A.V., Waldegger S., Lesslauer A., Vitzthum H., Suzuki Y., Luk J.M., Becker C. Mutations in the tight-junction gene claudin 19 (CLDN19) are associated with renal magnesium wasting, renal failure, and severe ocular involvement. Am. J. Hum. Genet. 2006;79:949–957. - PMC - PubMed
    1. Hou J., Paul D.L., Goodenough D.A. Paracellin-1 and the modulation of ion selectivity of tight junctions. J. Cell Sci. 2005;118:5109–5118. - PubMed
    1. Hou J., Renigunta A., Konrad M., Gomes A.S., Schneeberger E.E., Paul D.L., Waldegger S., Goodenough D.A. Claudin-16 and claudin-19 interact and form a cation-selective tight junction complex. J. Clin. Invest. 2008;118:619–628. - PMC - PubMed

Publication types

MeSH terms