. 2011 Jun;52(6):1084-1097.
doi: 10.1194/jlr.M012872. Epub 2011 Mar 11.

siRNA-induced liver ApoB knockdown lowers serum LDL-cholesterol in a mouse model with human-like serum lipids

Affiliations

siRNA-induced liver ApoB knockdown lowers serum LDL-cholesterol in a mouse model with human-like serum lipids

Marija Tadin-Strapps et al. J Lipid Res. 2011 Jun.

Abstract

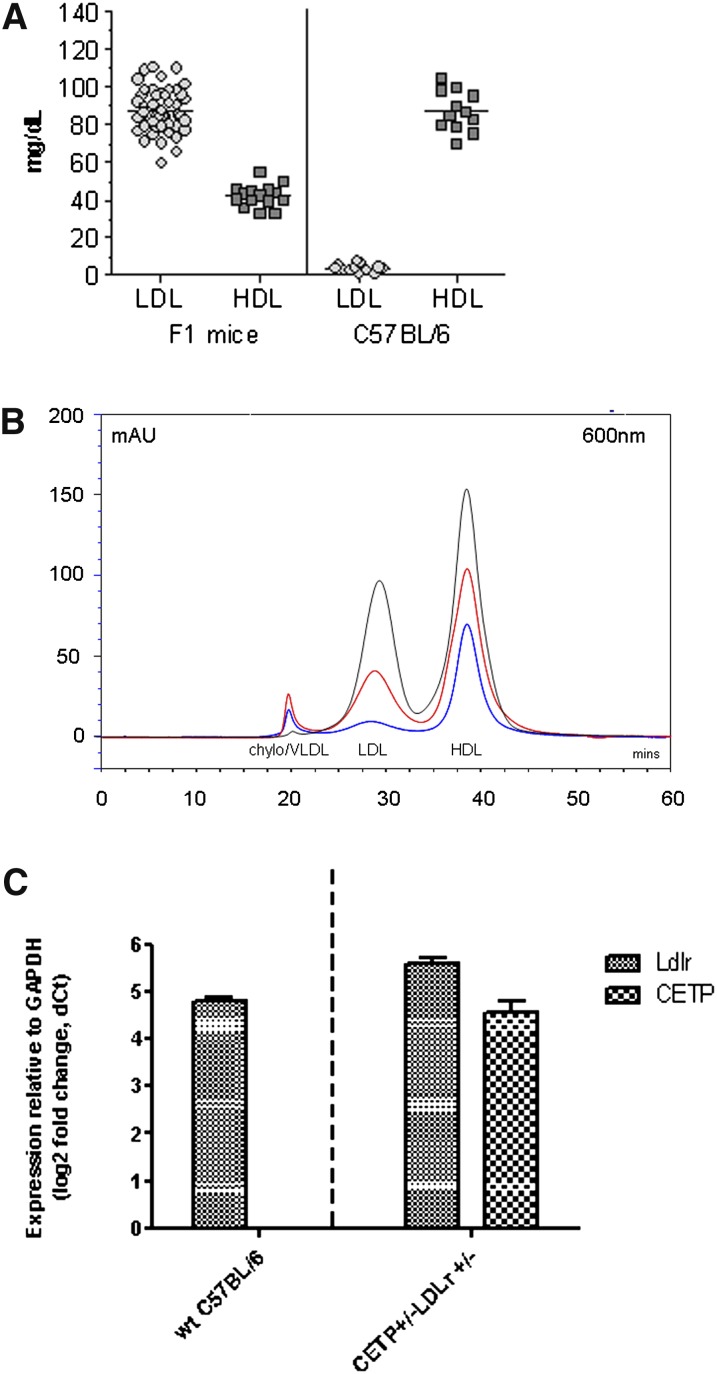
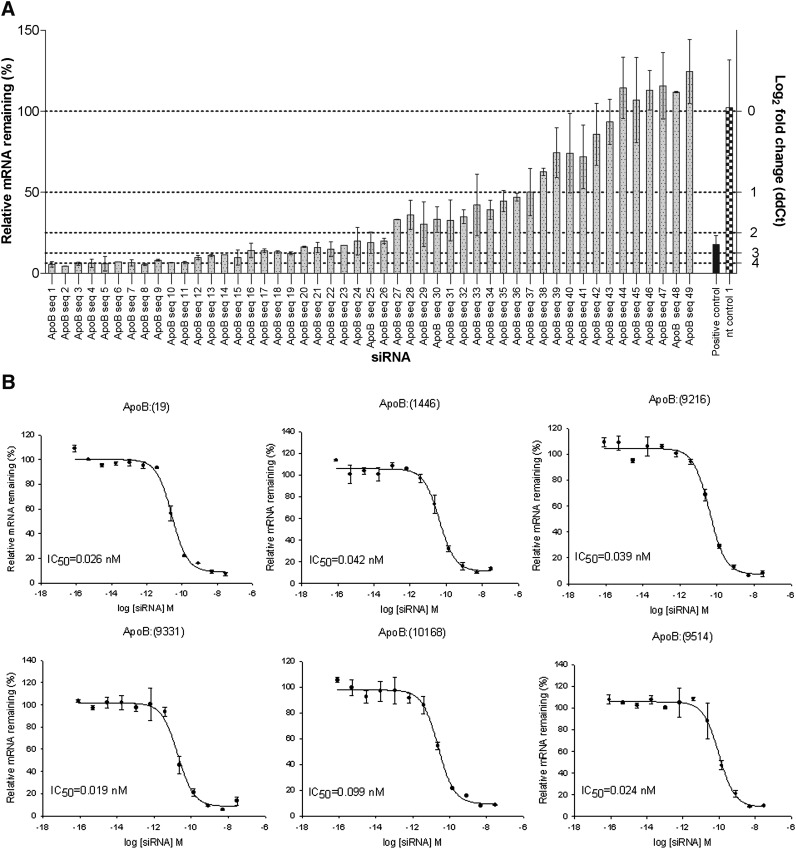
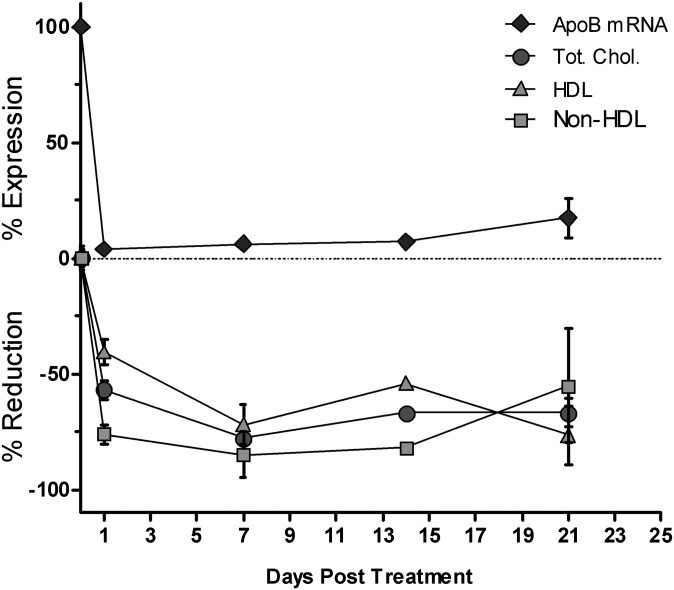
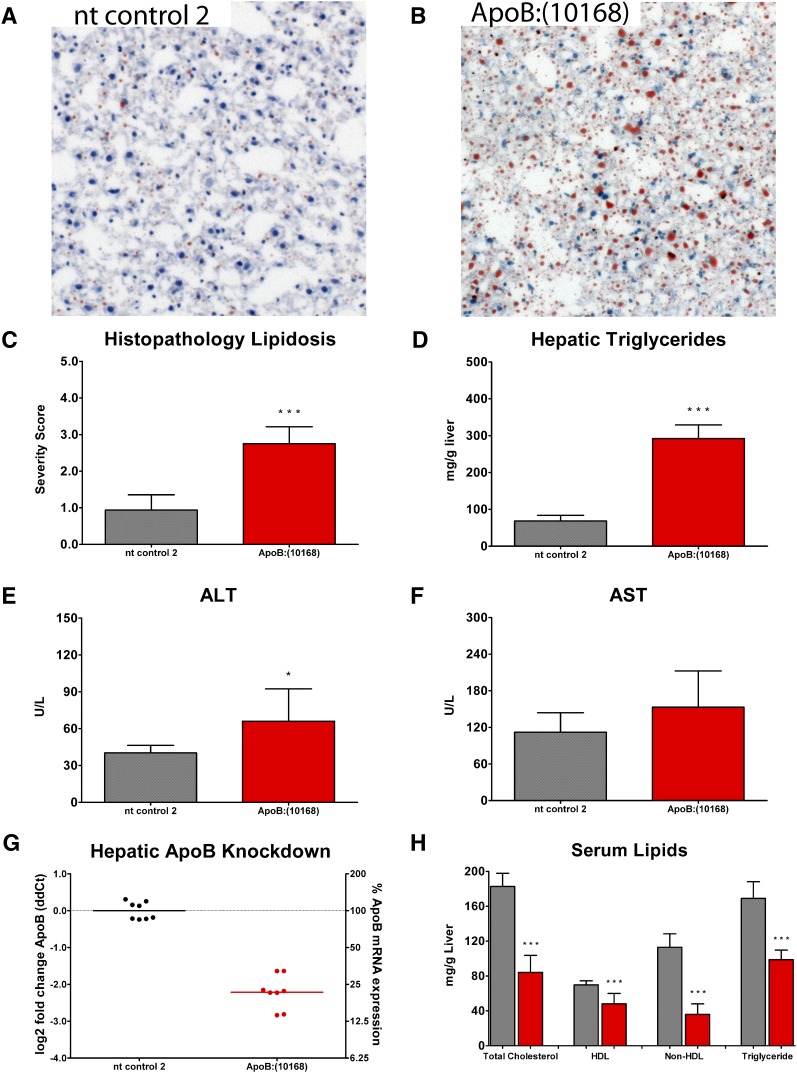
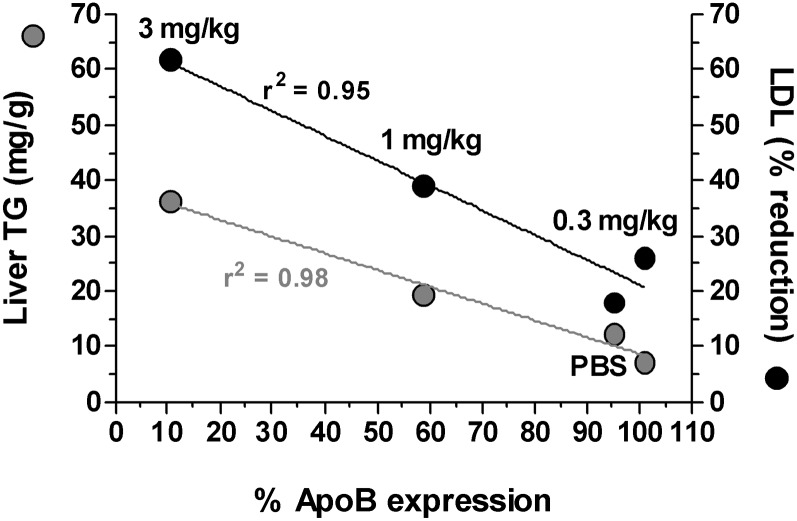
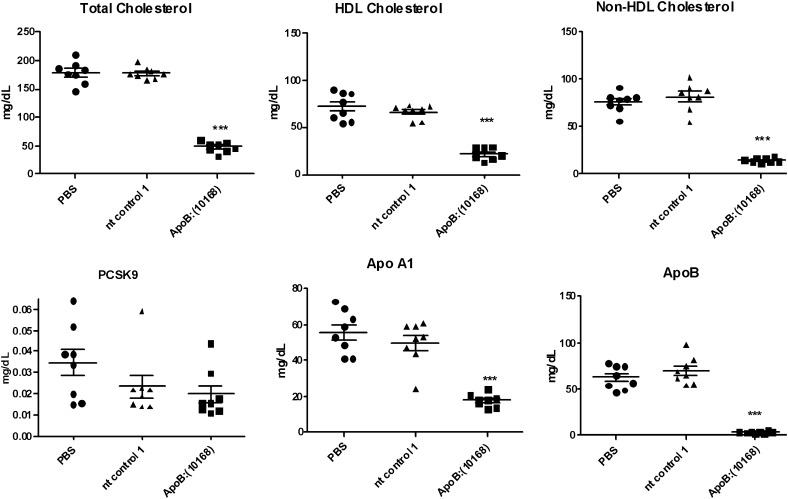
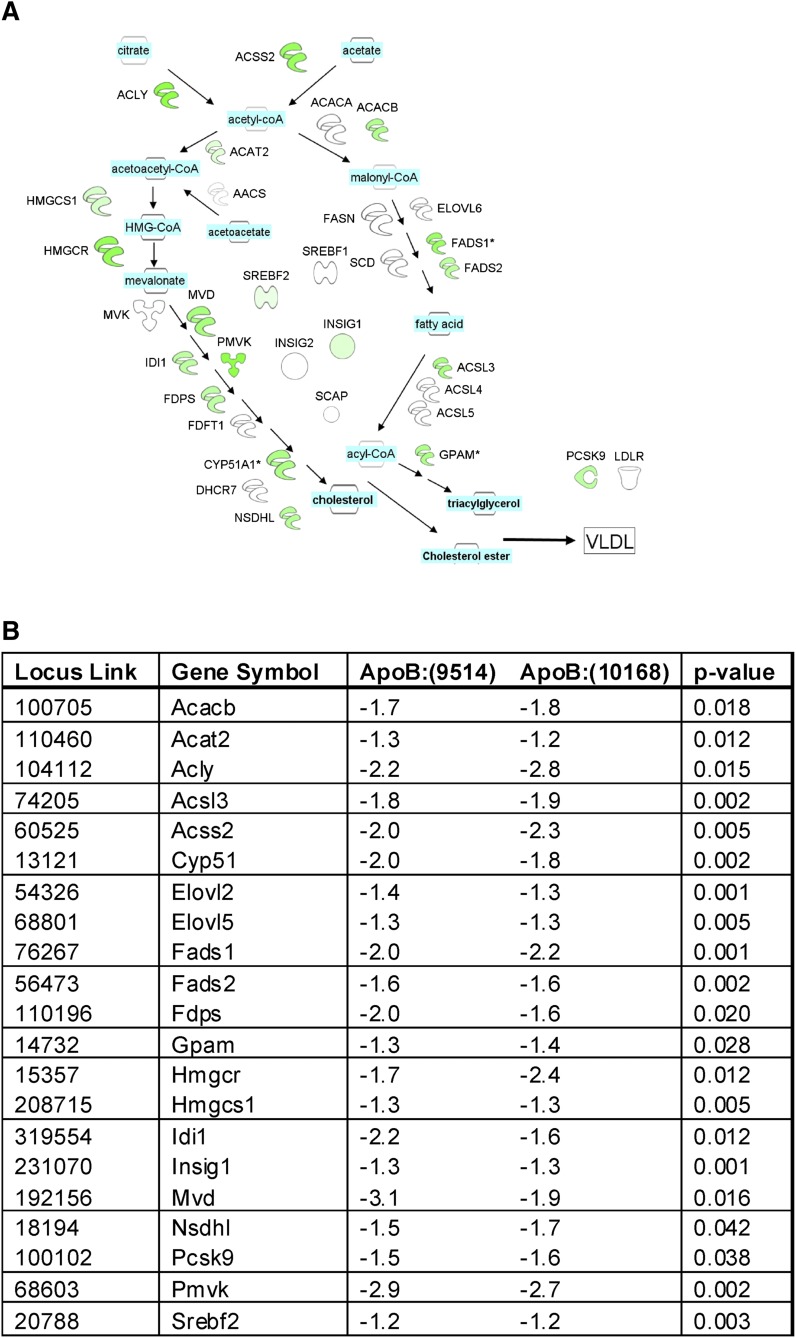
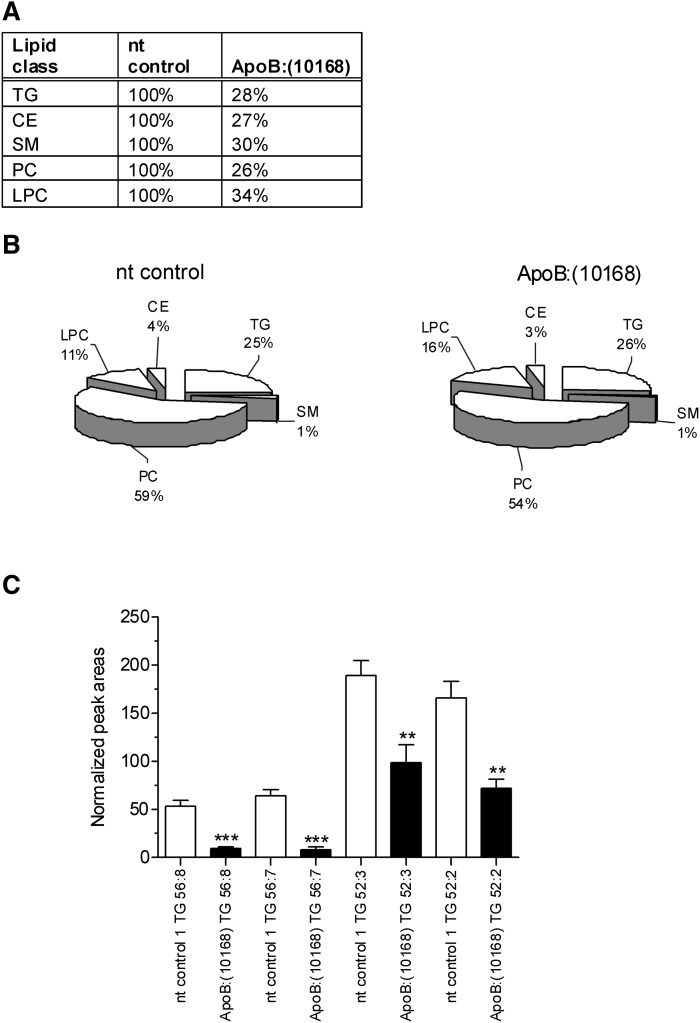
Increased serum apolipoprotein (apo)B and associated LDL levels are well-correlated with an increased risk of coronary disease. ApoE⁻/⁻ and low density lipoprotein receptor (LDLr)⁻/⁻ mice have been extensively used for studies of coronary atherosclerosis. These animals show atherosclerotic lesions similar to those in humans, but their serum lipids are low in apoB-containing LDL particles. We describe the development of a new mouse model with a human-like lipid profile. Ldlr CETP⁺/⁻ hemizygous mice carry a single copy of the human CETP transgene and a single copy of a LDL receptor mutation. To evaluate the apoB pathways in this mouse model, we used novel short-interfering RNAs (siRNA) formulated in lipid nanoparticles (LNP). ApoB siRNAs induced up to 95% reduction of liver ApoB mRNA and serum apoB protein, and a significant lowering of serum LDL in Ldlr CETP⁺/⁻ mice. ApoB targeting is specific and dose-dependent, and it shows lipid-lowering effects for over three weeks. Although specific triglycerides (TG) were affected by ApoB mRNA knockdown (KD) and the total plasma lipid levels were decreased by 70%, the overall lipid distribution did not change. Results presented here demonstrate a new mouse model for investigating additional targets within the ApoB pathways using the siRNA modality.


Figures

Fig. 1.
Fig. 1.
A: A new mouse model with human-like lipoprotein profiles obtained by genetically induced LDL phenotype that was enhanced by mild increases in dietary fat in Ldlr CETP+/– hemizygous mice. Contrary to wild-type mice whose serum lipids are predominantly HDL particles, serum lipids in Ldlr CETP+/– hemizygous mice have a significant contribution of LDL cholesterol (LDL) and reduced levels of HDL cholesterol (HDL). B: FPLC lipoprotein profile of C57Bl/6 (blue) and Ldlr CETP+/– hemizygous (red) mice. Plasma (25 µl) was injected and separated using a Sepharose 6 size-exclusion column, and total cholesterol in each lipoprotein particle was measured using an in-line detection system (see Materials and Methods). Larger particles, Chylo/VLDL (chylomicrons and very low-density lipoprotein) are detected from the column first, then remnant and LDL (low-density lipoprotein) particles, followed by smaller-sized HDL (high-density lipoprotein) particles. As shown, lipid profile of Ldlr CETP+/– hemizygous mice (red) more closely resembles that of humans (black) than does the lipid profile of C57Bl/6 mice (blue). C: Relative expression levels of mouse Ldlr and human CETP transcripts in liver homogenates from wild-type (wt) C57Bl/6 mice and Ldlr CETP+/– hemizygous mice. Expression was determined relative to GAPDH levels. As expected, liver Ldlr levels in the Ldlr CETP+/– hemizygous mice were roughly half that of the wt C57Bl/6 mice. No expression of human CETP transgene was detected in wt animals. (Ct = cycle threshold; dCt = Ct Target – Ct GAPDH). Bars represent the mean ± SD for N = 3.
Fig. 2.
Fig. 2.
A: ApoB siRNA screen in mouse Hepa 1-6 cells. An amount of 49 siRNAs designed against mouse ApoB were tested for ApoB mRNA knockdown at 24 h post transfection. A total of 28 siRNAs (57%) showed greater than 80% target knockdown. nt control 1, nontargeting siRNA control 1. Bars represent a mean of two biological replicas ± SD. B: Dose response curves of ApoB siRNAs in mouse Hepa 1-6 cells. The dose response for the top six ApoB siRNAs was evaluated to determine their potency. Calculated IC50 values for all siRNAs were found to be in the subnanomolar range. Average of two biological replicas ± SD is shown.
Fig. 3.
Fig. 3.
Three-week single dose time-course study in Ldlr CETP+/– mice. Animals were dosed intravenously with a single 3 mg/kg dose of OCD-ApoB:(10168). ApoB liver mRNA knockdown, and serum total cholesterol, HDL, and nonHDL were determined at days 1, 7, 14, and 21 post siRNA dosing. Both ApoB mRNA knockdown and serum lipid lowering were maintained over the course of three weeks. Mean for N = 8 ± SD is shown.
Fig. 4.
Fig. 4.
A, B: Representative images for Oil Red O-stained liver sections 15 days following a singe 3 mg/kg dose of OCD-ApoB:(10168) or nontargeting siRNA control 2 (nt control 2) reveal an increase in lipid accumulation (red) following OCD-ApoB siRNA treatment relative to the nt control siRNA group. C: Lipid accumulation was scored using a subjective scoring system (0-4), with 0 representing normal, 1 a minimal change, 2 a mild change, 3 a moderate change, and 4 representing a marked increase in lipid accumulation. D: An increase in hepatic lipids was associated with an elevation in hepatic triglyceride levels for the OCD-ApoB group. E, F: Elevated hepatic triglycerides are associated with a slight increase in serum ALT (P < 0.05) and AST (not significant) levels. G: The relative expression of ApoB was reduced in the liver. H: Serum lipids (TC, HDL, nonHDL, and TGs) decreased. In C, D, E, F, and H, bars represent the mean ± SD for N = 8. In G, individual animals (circles) with the group mean (bars) are shown.
Fig. 5.
Fig. 5.
The extent of ApoB knockdown correlates with serum LDL reductions and liver triglyceride increases. Ldlr CETP+/– mice were dosed with a single 3 mg/kg dose of LNP201-ApoB:(10168). Liver ApoB mRNA knockdown, TG content, and serum LDL changes were determined 1 week post siRNA dosing. Gray circles represent the liver triglyceride content (as mg TG/g liver tissue), and the black circles represent the percentage (%) LDL lowering. The mean of 6 animals per group is shown.
Fig. 6.
Fig. 6.
Changes in serum lipids and ApoA1, ApoB, and Pcsk9 serum protein levels following ApoB siRNA treatment in Ldlr CETP+/– mice. Animals were dosed with a single 3 mg/kg dose intravenously of either OCD-ApoB:(10168) or nontargeting control (nt control) siRNA-LNP. Serum lipids and serum protein levels were determined at day 5 following siRNA dosing (***P < 0.0001).
Fig. 7.
Fig. 7.
A: Changes in Srebp1 and 2 pathways in mouse livers after ApoB siRNA treatment. Liver mRNAs from PBS or OCD-ApoB:(10168) siRNA groups were profiled three days post treatment by microarray as described in Materials and Methods, then mapped onto the pathways shown here using the Ingenuity Path Designer (Ingenuity®Systems). The intensity of the node color indicates the degree of upregulation (red) or downregulation (green) of mRNA expression. Shown is the OCD-ApoB:(10168) treatment profile that was normalized to the PBS treatment. B: List of Srebp1 and Srebp2 genes regulated by ApoB KD. Values represent the transcriptional changes in the liver relative to PBS-treated animals. Significance is reported as the P value for both ApoB siRNA sequences [ApoB:(9514) and ApoB:(10168)] compared with PBS.
Fig. 1.
Fig. 1.
A: Hepatic ApoB KD results in approximately 70% decrease in serum lyso-phosphatidylcholines (LPC), sphingomyelins (SM), phosphatidylcholines (PC), triglycerides (TG), and cholesteryl esters (CE). B: ApoB KD reduces total lipid concentrations but does not affect overall lipid distribution in plasma. Values represent the percentage of each general plasma lipid class in mice treated with either nontargeting control 1 (nt control 1) siRNA (left pie graph) or ApoB:(10168) siRNA (right pie graph). Animals were dosed intravenously with a single 3 mg/kg dose of OCD-siRNAs and then euthanized at day 5 postdosing. Lipids were analyzed by LC/MS as described in the Materials and Methods. C: Differences in plasma TG profile after a single 3 mg/kg dose of OCD-ApoB:(10168) siRNA at day 5 postdosing. TG composition and analysis was performed by LC/MS as outlined in Materials and Methods. Triglycerides that were downregulated by treatment of OCD-ApoB:(10168), as compared with nt control 1, are shown (TG 56:8, TG 56:7, TG 52:3, TG 52:2). The differences in all TGs shown were statistically significant (P < 0.05, 1-way ANOVA with Bonferroni posttest; nt control versus ApoB). Triglyceride nomenclature used here follows guidance as outlined by LIPID MAPS (http://lipidmaps.org). In the TG nomenclature, the first number stands for the total number of hydrocarbons in the FFA in the TG moiety, while the second number after the colon represents the number of double bonds in the fatty acyl substituents attached to the glycerol backbone.

Similar articles

Cited by

References

    1. Wouters K., Shiri-Sverdlov R., van Gorp P. J., van Bilsen M., Hofker M. H. 2005. Understanding hyperlipidemia and atherosclerosis: lessons from genetically modified apoe and ldlr mice. Clin. Chem. Lab. Med. 43: 470–479. - PubMed
    1. Maron D. J., Fazio S., Linton M. F. 2000. Current perspectives on statins. Circulation. 101: 207–213. - PubMed
    1. Hobbs H. H., Brown M. S., Goldstein J. L. 1992. Molecular genetics of the LDL receptor gene in familial hypercholesterolemia. Hum. Mutat. 1: 445–466. - PubMed
    1. Schaefer E. J., Gregg R. E., Ghiselli G., Forte T. M., Ordavas J. M., Zech L. A., Brewer H. B., Jr 1986. Familial apolipoprotein E deficiency. J. Clin. Invest. 78: 1206–1219. - PMC - PubMed
    1. Havekes L., de Wit E., Leuven J. G., Klasen E., Utermann G., Weber W., Beisiegel U. 1986. Apolipoprotein E3-Leiden. A new variant of human apolipoprotein E associated with familial type III hyperlipoproteinemia. Hum. Genet. 73: 157–163. - PubMed

MeSH terms