. 2011 Jul;193(14):3433-45.
doi: 10.1128/JB.01411-10. Epub 2011 Mar 11.

Non-identity-mediated CRISPR-bacteriophage interaction mediated via the Csy and Cas3 proteins

Affiliations

Non-identity-mediated CRISPR-bacteriophage interaction mediated via the Csy and Cas3 proteins

Kyle C Cady et al. J Bacteriol. 2011 Jul.

Abstract

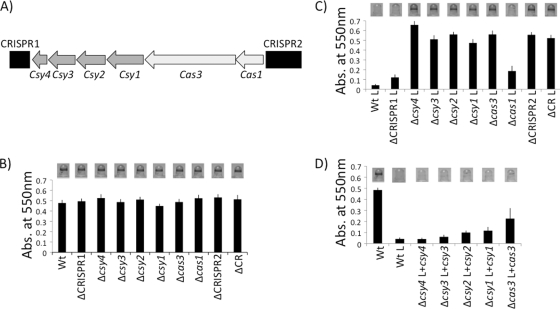
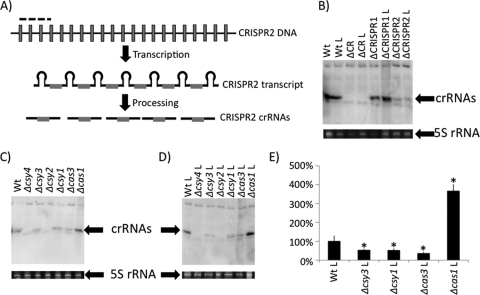
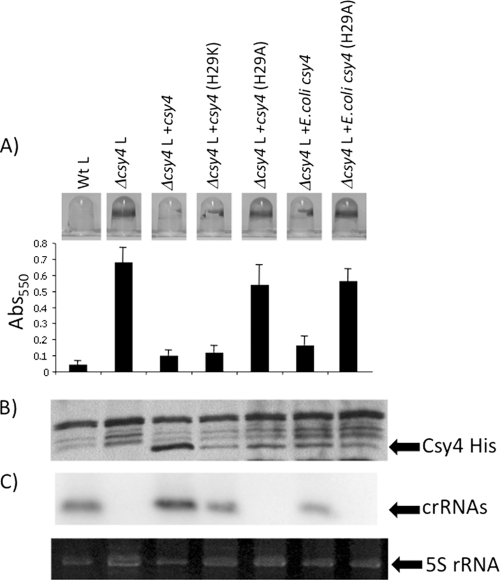
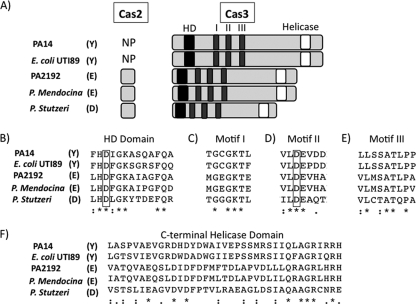
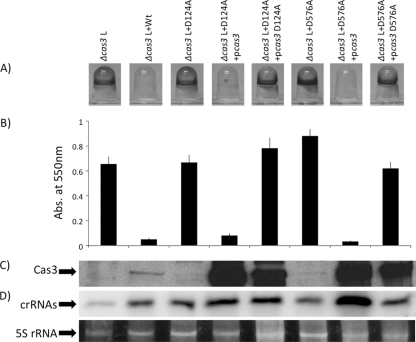
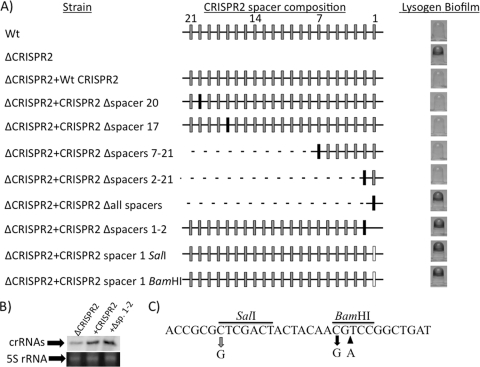
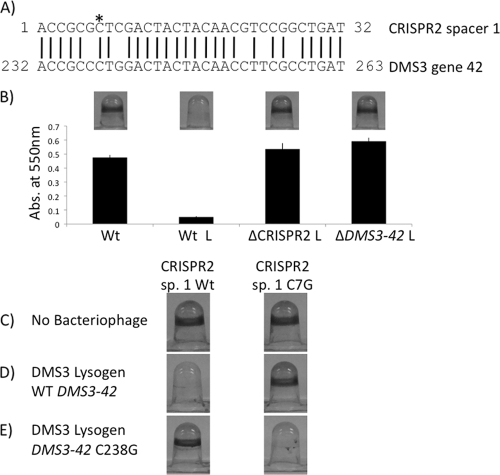
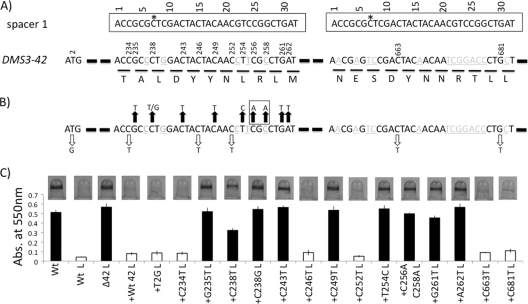
Studies of the Escherichia, Neisseria, Thermotoga, and Mycobacteria clustered regularly interspaced short palindromic repeat (CRISPR) subtypes have resulted in a model whereby CRISPRs function as a defense system against bacteriophage infection and conjugative plasmid transfer. In contrast, we previously showed that the Yersinia-subtype CRISPR region of Pseudomonas aeruginosa strain UCBPP-PA14 plays no detectable role in viral immunity but instead is required for bacteriophage DMS3-dependent inhibition of biofilm formation by P. aeruginosa. The goal of this study is to define the components of the Yersinia-subtype CRISPR region required to mediate this bacteriophage-host interaction. We show that the Yersinia-subtype-specific CRISPR-associated (Cas) proteins Csy4 and Csy2 are essential for small CRISPR RNA (crRNA) production in vivo, while the Csy1 and Csy3 proteins are not absolutely required for production of these small RNAs. Further, we present evidence that the core Cas protein Cas3 functions downstream of small crRNA production and that this protein requires functional HD (predicted phosphohydrolase) and DEXD/H (predicted helicase) domains to suppress biofilm formation in DMS3 lysogens. We also determined that only spacer 1, which is not identical to any region of the DMS3 genome, mediates the CRISPR-dependent loss of biofilm formation. Our evidence suggests that gene 42 of phage DMS3 (DMS3-42) is targeted by CRISPR2 spacer 1 and that this targeting tolerates multiple point mutations between the spacer and DMS3-42 target sequence. This work demonstrates how the interaction between P. aeruginosa strain UCBPP-PA14 and bacteriophage DMS3 can be used to further our understanding of the diverse roles of CRISPR system function in bacteria.


Figures

Fig. 1.
Fig. 1.
Deletion and complementation analysis of P. aeruginosa PA14 CRISPR region. (A) Chromosomal organization of the CRISPR genomic region, including the two CRISPRs and CRISPR-associated (cas) genes. CRISPRs are shown as black boxes, Yersinia-subtype cas genes are depicted as dark gray arrows, and core cas genes found in multiple CRISPR subtypes are diagrammed as light gray arrows. (B) Biofilm phenotypes of wild-type and deletion mutants in the absence of bacteriophage DMS3 (nonlysogens). A representative image of the biofilm formed by each strain is shown above the quantification of results for 8 independent wells. The ΔCRISPR1 strain has only CRISPR1 deleted, the ΔCRISPR2 strain has only CRISPR2 deleted, and the ΔCR strain has both CRISPRs and the cas genes they flank deleted. (C) Biofilm phenotypes of bacteriophage DMS3-infected (DMS3 lysogens) wild-type and mutant strains. A representative image of the biofilm formed by each strain is shown above the quantification of results for 8 independent wells. An “L” following a strain designation, in this panel and panel D, indicates a strain lysogenized with DMS3. (D) Complementation analysis of the csy4, csy3, csy2, csy1, and cas3 mutants in DMS3 lysogens. A representative image of the biofilm formed by each strain is shown above the quantification of results for 8 independent wells.
Fig. 2.
Fig. 2.
Characterization of small crRNA production by CRISPR region mutants. (A) Diagram showing CRISPR DNA transcribed into a long CRISPR transcript, which is processed into mature crRNAs by Cas proteins. The portion of CRISPR2 utilized as the probe for Northern blot analysis is denoted by a dashed line. Unique spacer sequences are shown as gray boxes, while repeat sequences are represented by black lines. (B) Detection of in vivo small crRNA production by WT, ΔCRISPR1, ΔCRISPR2, and ΔCRISPR region nonlysogens and lysogens by using Northern blot analysis. Also shown is the 5S rRNA band for each of the corresponding RNA preparations used in the Northern blot analysis. (C) Shown is a representative Northern blot (top) of crRNA production by each cas mutant in the absence of DMS3. Also shown is the 5S rRNA band for each of the corresponding RNA preparations used in the Northern blot analysis. (D) Shown is a representative Northern blot (top) of crRNA production by cas mutants in the presence of DMS3 (lysogens). Also shown is the 5S rRNA band for each of the corresponding RNA preparations used in the Northern blot analysis. (E) Quantification of representative data shown in panel D. Shown is an average calculated from three replicate experiments. The bars indicate standard deviation. *, Significantly different from the WT, P < 0.05. An “L” following the genotype designation indicates a strain lysogenized with DMS3.
Fig. 3.
Fig. 3.
In vivo analysis of P. aeruginosa and E. coli Csy4. (A) Shown are the abilities of P. aeruginosa and E. coli plasmid-expressed WT and Csy4 mutants to complement the intact biofilm phenotype resulting from a Δcsy4 mutation in the presence of bacteriophage DMS3 in comparison to a WT lysogen. An “L” following the genotype designation indicates a strain lysogenized with DMS3. A representative image of the biofilm formed by each strain is shown above the quantification of results of 8 independent wells. (B) Western blot analysis of strain indicated in panel A. The His-tagged Cys4 protein was detected using anti-His antibody. (C) Northern blot analysis of small crRNA production by each mutant indicated in panel A. In this experiment, the three spacers and two repeats closest to the cas1 gene of CRISPR2 of P. aeruginosa PA14 was used as the probe (see Fig. 2A). Also shown at the bottom of this panel is the 5S rRNA band for each of the corresponding RNA preparations used in the Northern blot analysis.
Fig. 4.
Fig. 4.
Conservation and domain architecture of Cas3 from multiple CRISPR region subtypes. (A) Columns (from left to right): bacterial strain harboring CRISPR region, subtype of CRISPR regions (Y, Yersinia; E, Escherichia; D, Desulfovibrio), presence or absence of cas2 sequence (NP, not present), and the cas3-encoded product. Black boxes denote HD domains, dark gray boxes represent conserved motifs of DEXD/H domains, and white boxes show location of C-terminal helicase domains. (B to F) Conservation of Cas3 amino acid sequence around each domain/motif. Stars represent residues that are 100% conserved, and black dots represent highly conserved sequences. Boxes are drawn around key residues chosen for mutational analysis.
Fig. 5.
Fig. 5.
Requirement of the D124 and D576 residues of Cas3 for in vivo function. (A) Shown are the biofilm phenotypes of strains carrying the WT Cas3, as well as the Cas3(D124A) and Cas3(D576A) mutants, in the presence of bacteriophage DMS3. A representative picture of the biofilm formed by each strain is shown. An “L” following a genotype designation indicates a strain lysogenized with DMS3. (B) Quantification of biofilm formed by each strain. The data shown are average values from eight independent wells. (C) Western analysis of WT and mutant Cas3 proteins for each strain indicated, as detected by an anti-Cas3 antibody. (D) Northern blot analysis of small crRNA production of each strain. As in Fig. 2 and 3, the three spacers and two repeats closest to the cas1 gene of CRISPR2 of P. aeruginosa PA14 were used as the probe. Also shown at the bottom of this panel is the 5S rRNA band for each of the corresponding RNA preparations used in the Northern blot analysis.
Fig. 6.
Fig. 6.
CRISPR2 spacer content required for bacteriophage-mediated biofilm inhibition. (A) The left column shows the name of the WT or CRISPR2 mutant strain diagrammed in the center column. The CRISPR2 schematic representation depicts repeat sequences as black lines, deleted sequence as dotted lines, WT spacers of PA14 CRISPR2 as gray boxes, P. aeruginosa strain 2192 CRISPR1 spacer 8 as black boxes, and point mutations within spacer 1 as white boxes. Wild-type PA14 CRISPR2 spacer numbers are shown in intervals of 7 at the top of the center column, allowing orientation of various spacer mutations. The right column provides a representative image of the biofilm phenotype of each DMS3-infected WT and mutant strain. (B) Northern blot analysis demonstrating that the Δspacers1-2 (Δsp. 1–2) mutant produces a level of small crRNAs similar to that of the WT CRISPR2-complemented strain. The three spacers and two repeats closest to the cas1 gene of CRISPR2 of P. aeruginosa PA14 were used as the probe. Also shown at the bottom of this panel is the 5S rRNA band for each of the corresponding RNA preparations used in the Northern blot analysis. (C) Shown is the sequence of CRISPR2 spacer 1. The gray arrow shows the site of the mutation caused by introduction of the SalI site, and the black arrows show the site of the mutation (left arrow) and base insertion (right arrow) caused by introduction of the BamHI site. The black bar indicates the nucleotides comprising the restriction sites.
Fig. 7.
Fig. 7.
DMS3-42 is targeted by CRISPR2 spacer 1. (A) Alignment of the CRISPR2 spacer 1 sequence with the complementary portion of the DMS3-42 sequence. The DMS3-42 numbering is measured from the putative translational start site. The asterisk denotes the location of spacer 1 C7G point mutation. (B) The biofilm phenotypes of WT nonlysogen, as well as the DMS3 infected-WT, ΔCRISPR2 and ΔDMS3-42 mutants. A representative image of the biofilm formed by each strain is shown above the quantification of results for 8 independent wells. An “L” following a strain designation indicates a strain lysogenized with DMS3. (C) Representative images of the biofilm phenotypes of the WT and the spacer 1 (sp. 1) C7G point mutant (harboring a SalI restriction site) in the absence of bacteriophage. (D) Biofilm phenotypes of the WT and the spacer 1(C7G) mutant lysogenized by bacteriophage DMS3. (E) Biofilm phenotypes of the WT and spacer 1(C7G) mutant bacteria lysogenized by DMS3-42(C238G) mutant bacteriophage DMS3.
Fig. 8.
Fig. 8.
Non-identity-mediated targeting of CRISPR2 spacer 1 to DMS3-42. (A) Shown is a diagram of CRISPR2 spacer 1 (top) and selected regions of the DMS3-42 gene (bottom). The putative ATG translational start site of DMS3-42 is shown to the left, while the two regions of complementarity between CRISPR2 spacer 1 and DMS3-42 are shown to the right (with the flanking gene sequence denoted by a thick dashed line). CRISPR2 spacer 1 sequence is boxed and aligned with the two complementary regions of DMS3-42. Light gray, underlined DMS3-42 nucleotides are not identical between CRISPR2 spacer 1 and DMS3-42. The two CRISPR2 spacer 1 sequences have been numbered for ease of analysis, and an asterisk placed at the site of the C7G point mutation. The locations of point mutations made in the DMS3-42 gene are shown above the DMS3-42 nucleotide sequence. The putative amino acid sequence of the regions of complementarity is shown below DMS3-42 nucleotide sequence. (B) DMS3-42 point mutations that retain or abolish CRISPR2 spacer 1-mediated biofilm inhibition. Black arrows signify point mutations that restored biofilm formation in the presence of DMS3, while white arrows denote those that had no detectable effect on biofilm phenotype. The C256/C258 double mutant is boxed. (C) Representative image of the biofilm phenotype of each indicated strain from the quantification of results for at least 7 biofilm wells. White bars signify strains that retain the phenotype of the WT lysogen, that is, no biofilm formation, while black bars denote strains that show restored biofilm formation.

Comment in

Similar articles

Cited by

References

    1. Barrangou R., et al. 2007. CRISPR provides acquired resistance against viruses in prokaryotes. Science 315:1709–1712 - PubMed
    1. Beloglazova N., et al. 2008. A novel family of sequence-specific endoribonucleases associated with the clustered regularly interspaced short palindromic repeats. J. Biol. Chem. 283:20361–20371 - PMC - PubMed
    1. Brouns S., et al. 2008. Small CRISPR RNAs guide antiviral defense in prokaryotes. Science 321:960–964 - PMC - PubMed
    1. Budzik J., Rosche W., Rietsch A., O'Toole G. 2004. Isolation and characterization of a generalized transducing phage for Pseudomonas aeruginosa strains PAO1 and PA14. J. Bacteriol. 186:3270–3273 - PMC - PubMed
    1. Cady K. C., et al. 2011. Prevalence, conservation and functional analysis of Yersinia and Escherichia CRISPR regions in clinical Pseudomonas aeruginosa isolates. Microbiology 157:430–437 - PubMed

Publication types

MeSH terms