. 2011 Apr 15;186(8):4640-8.
doi: 10.4049/jimmunol.1001946. Epub 2011 Mar 11.

Anergic responses characterize a large fraction of human autoreactive naive B cells expressing low levels of surface IgM

Affiliations

Anergic responses characterize a large fraction of human autoreactive naive B cells expressing low levels of surface IgM

Tâm D Quách et al. J Immunol. .

Abstract

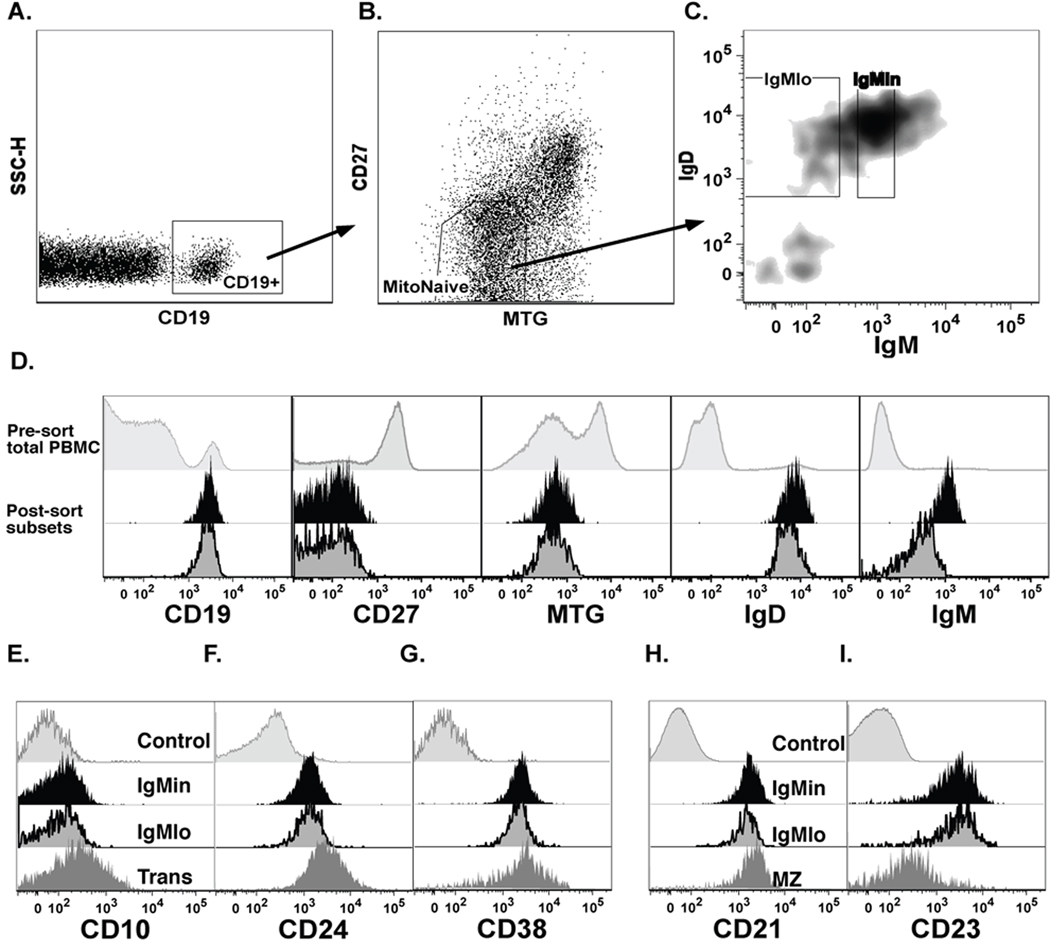
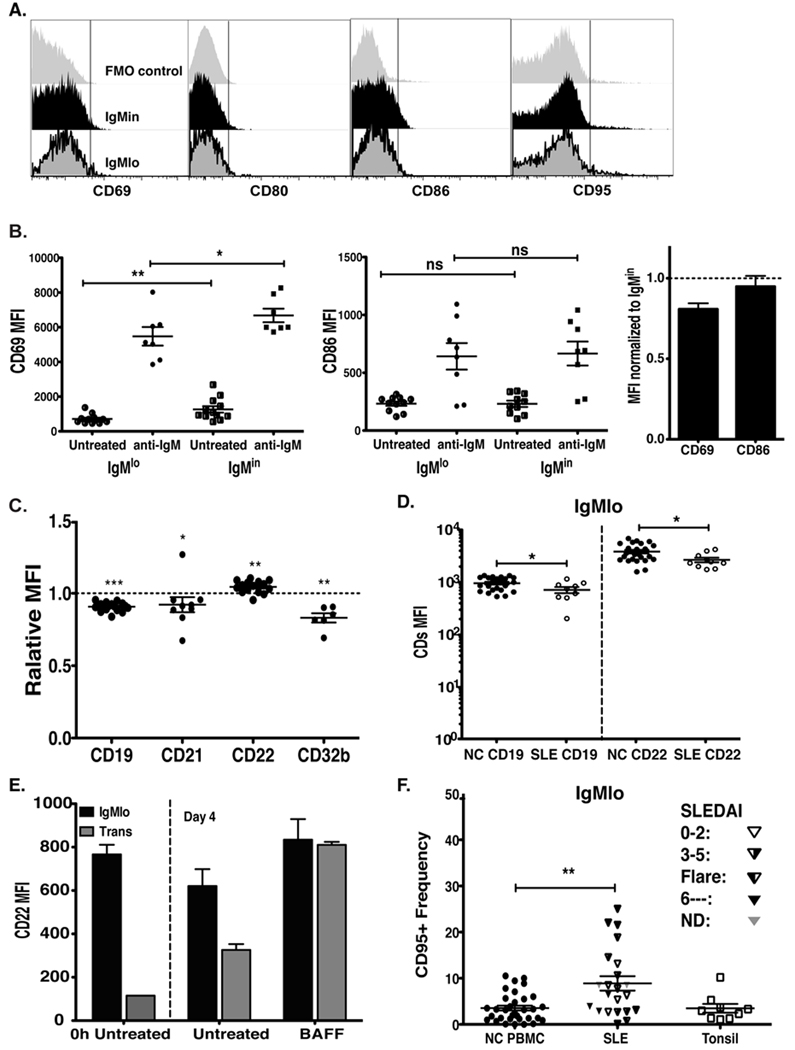
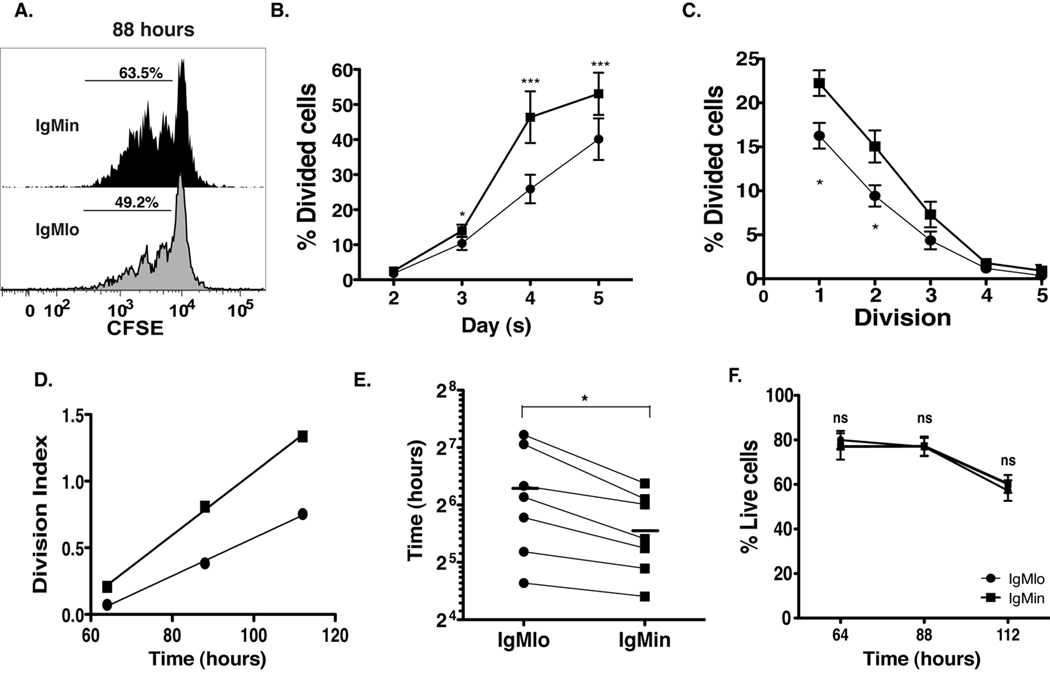
B cell anergy represents an important mechanism of peripheral immunological tolerance for mature autoreactive B cells that escape central tolerance enforced by receptor editing and clonal deletion. Although well documented in mice, the extent of its participation in human B cell tolerance remains to be fully established. In this study, we characterize the functional behavior of strictly defined human naive B cells separated on the basis of their surface IgM (sIgM) expression levels. We demonstrate that cells with lower sIgM levels (IgM(lo)) are impaired in their ability to flux calcium in response to either anti-IgM or anti-IgD cross-linking and contain a significantly increased frequency of autoreactive cells compared with naive B cells with higher levels of sIgM. Phenotypically, in healthy subjects, IgM(lo) cells are characterized by the absence of activation markers, reduction of costimulatory molecules (CD19 and CD21), and increased levels of inhibitory CD22. Functionally, IgM(lo) cells display significantly weaker proliferation, impaired differentiation, and poor Ab production. In aggregate, the data indicate that hyporesponsiveness to BCR cross-linking associated with sIgM downregulation is present in a much larger fraction of all human naive B cells than previously reported and is likely to reflect a state of anergy induced by chronic autoantigen stimulation. Finally, our results indicate that in systemic lupus erythematosus patients, naive IgM(lo) cells display increased levels of CD95 and decreased levels of CD22, a phenotype consistent with enhanced activation of autoreactive naive B cells in this autoimmune disease.


Figures

Figure 1
Figure 1. Correlation of sIgM expression level on peripheral human naïve B cells and their responsiveness
A, Gating strategy for the analysis of Ca++ flux in IgMlo cells. Total peripheral blood B cells were purified using human B cell enrichment RosetteSep Kit (86–94% purity), loaded with Indo-AM, and then stained with exclusion markers (anti-CD2, CD14, CD16, CD36, CD43 and CD235a), anti-CD27, IgM and IgG antibodies. Live naïve B cells were gated on those that were indo-pos, CD27-neg and IgG-neg, exclusion-neg. Subsequently, cells with low surface IgM as compared to control naïve cells expressing higher levels were analyzed according to the gates shown in the figure. B and C, Indo ratio reflecting mean fluorescence of fluxing calcium (upper panels), and the frequency of responding cells (lower panels), upon stimulation with anti-IgM (B) or anti-IgD (C) were analyzed vs. time to compare the calcium flux ability of IgM “negative” (IgMlo) cells with IgM “positive” (IgMin-hi) cells. D, Live CD27-neg, Exclusion-neg cells were gated and IgM density was displayed. Events in this gate were subdivided into 50 fractions (2% each). E, IgM median fluorescence intensity (MFI) value from each fraction from D was obtained using Flowjo and plotted against the frequency of responding cells above the pre-stimulation baseline. Representative plots, from 14 independent experiments (donors, n=12), show the sIgM MFI vs. the frequency of responding cells upon stimulation with either anti-IgM (left) or anti-IgD (right). The correlation of sIgM MFI and frequency of responding cells was calculated by the Graphpad Prism and was then rechecked with SAS statistical analysis software. SAS were used to calculate the ED90, the sIgM MFI value at which the response achieved 90% of the maximal response (dash line, nonlinear fit curve; solid line, smooth curve). F and G, IgMlo cells, from B and C, were reanalyzed in the absence of BND (the 25% fraction of IgMlo cells that are at the lowest end of sIgM expression spectrum) to evaluate their ability to flux Ca++ in response to the stimulants, and compared to those of IgMin-hi
Figure 2
Figure 2. Expression of naïve markers on IgMlo and IgMin cells
A, Plots show the identification of IgMlo and IgMin cells. Upon gating on conventional naïve markers, CD19-pos, CD27-neg, MTG-pos, and IgD-pos, cells within the naïve compartment were divided into IgMlo and IgMin cells, as defined before. B, Overlay histograms showing representative post sort results of surface marker analysis of IgMlo and IgMin cells as compared to total PBMC (pre-sort). C and D, Total PBMC cells were stained with developmental markers, CD10, CD24, CD38, CD21, CD23 to identify the phenotypic differences of IgMlo as compared to IgMin cells and other B-cell subsets: Trans (Transitional cells: CD19-pos, CD27-neg, MTG-pos, IgD-pos) and MZ (Marginal Zone/Unswitched Memory cells: CD19-pos, CD27-pos, IgD-pos).
Figure 3
Figure 3. Surface expression of co-stimulatory/inhibitory molecules on IgMlo cells
PBMC were stained with CD19, MTG, CD27, IgD, IgM, and CD69, plus CD80, CD86, CD95, CD21, CD22, or CD32b for flow analysis. A, Representative histograms showing CD69, CD80, CD86, and CD95 surface expression on IgMlo (bottom) and IgMin (middle) cells compared to FMO control (fluorescence minus one, top row). B, B cells from naïve compartments (IgMlo and IgMin) were sorted and placed in culture with or without anti-IgM for 18 hours, and stained for CD69 and CD86 expression (each data point represents MFI results from an independent experiment). The bar graph shows the relative CD69 and CD86 MFI of IgMlo cells as compared to IgMin cells after stimulating with anti-IgM for 18 hours. C, Relative MFI ratios of tested BCR co-regulators, CD19, CD21, and inhibitors, CD22, CD32b expression levels of IgMlo / IgMin (*p < 0.05, **p < 0.005, ***p < 0.0001). D, MFI values of surface CD19 and CD22 of IgMlo cells from healthy control (NC) and Lupus donors (SLE). E, CD22 expression by IgMlo and transitional B cells (CD19-pos, CD27-neg, MTG-pos, IgD-pos) cultured with or without BAFF for 4 days. F, CD95-pos frequency of IgMlo cells from SLE PBMC, NC PBMC and NC tonsil. **p < 0.005 (Mann-Whitney test).
Figure 4
Figure 4. IgMlo cells have reduced proliferative capacity in response to in vitro stimulation
Naïve cells from peripheral blood were sorted as described in Figure 1, loaded with CFSE, and placed in culture with CpG (2.5 µg/ml), F(ab)’2 anti-IgM (2.5 µg/ml), IL-2 (10 ng/ml). Cultured cells were collected on day 3, 4, and 5 for proliferation and cell survival analysis. A, CFSE histogram shows the 4-day proliferation of IgMin and IgMlo cells. B, Frequency of cells having undergone at least one division (* p<0.05 & ***p<0.005). C, Frequency of dividing cells within each cell division. D, Division index (includes only cells that made at least one division) vs. time. Reciprocal slope of regression line gives time to subsequent divisions. E, Time to subsequent divisions of IgMlo and IgMin cells. F, Graph shows the percentage of live cells within total culture cells (ns, not significant). All data were collected from 7 independent experiments, and the analyses were performed as described in the Materials and Methods.
Figure 5
Figure 5. IgMlo cells have reduced total IgM production but increased frequency of autoreactive IgM antibody producing cells
A, Plot displays amount of total IgM antibody production of IgMlo and IgMin cells upon stimulation with CpG (2.5 µg/ml), F(ab)’2 anti-IgM (2.5 µg/ml), IL-2 (10 ng/ml), or CD40L and IL-21 (50 ng/ml). B, graph displays frequency of IgM-producing cells (left Y-axis) and frequency of autoantibody-producing cell (right Y-axis) among IgMlo* (IgMlo cells that were excluded of BND cells during cell sorting), IgMin, IgMhi cells (49) following stimulation with CpG, F(ab)’2 anti-IgM, and IL-2. C and D, Images show developed spots from ELISPOT assays for total IgM (C) and for autoreactive IgM antibodies (D). Equal numbers of viable cells from each population were assayed. Anti-IgM autoantibody producing cells (D) upon stimulation with CpG (2.5 µg/ml), F(ab)’2 anti-IgM (2.5 µg/ml), IL-2 (10ng/ml) (* p<0.05 & **p<0.005)

Similar articles

Cited by

References

    1. Goodnow CC, Adelstein S, Basten A. The need for central and peripheral tolerance in the B cell repertoire. Science. 1990;248:1373–1379. - PubMed
    1. Carsett R, Kohler G, Lamers MC. Transitional B Cells Are the Target of Negative Selection in the B Cell Compartment. J. Exp. Med. 1995;181 - PMC - PubMed
    1. Hartley SB, Crosbie J, Brink R, Kantor AB, Basten A, Goodnow CC. Elimination from peripheral lymphoid tissues of self-reactive B lymphocytes recognizing membrane-bound antigens. Nature. 1991;353:765–769. - PubMed
    1. Roark JH, Bui A, Nguyen KA, Mandik L, Erikson J. Persistence of functionally compromised anti-double-stranded DNA B cells in the periphery of non-autoimmune mice. Int. Immunol. 1997;9:1615–1626. - PubMed
    1. Liu X, Shen S, Manser T. Influence of B Cell Antigen Receptor Expression Level on Pathways of B Cell Tolerance Induction. J Immunol. 2009;182:398–407. - PMC - PubMed

Publication types

MeSH terms