PRIMe: a method for characterization and evaluation of pleiotropic regions from multiple genome-wide association studies
- PMID: 21398673
- PMCID: PMC3109517
- DOI: 10.1093/bioinformatics/btr116
PRIMe: a method for characterization and evaluation of pleiotropic regions from multiple genome-wide association studies
Abstract
Motivation: The concept of pleiotropy was proposed a century ago, though up to now there have been insufficient efforts to design robust statistics and software aimed at visualizing and evaluating pleiotropy at a regional level. The Pleiotropic Region Identification Method (PRIMe) was developed to evaluate potentially pleiotropic loci based upon data from multiple genome-wide association studies (GWAS).
Methods: We first provide a software tool to systematically identify and characterize genomic regions where low association P-values are observed with multiple traits. We use the term Pleiotropy Index to denote the number of traits with low association P-values at a particular genomic region. For GWAS assumed to be uncorrelated, we adopted the binomial distribution to approximate the statistical significance of the Pleiotropy Index. For GWAS conducted on traits with known correlation coefficients, simulations are performed to derive the statistical distribution of the Pleiotropy Index under the null hypothesis of no genotype-phenotype association. For six hematologic and three blood pressure traits where full GWAS results were available from the Cohorts for Heart and Aging Research in Genomic Epidemiology (CHARGE) Consortium, we estimated the trait correlations and applied the simulation approach to examine genomic regions with statistical evidence of pleiotropy. We then applied the approximation approach to explore GWAS summarized in the National Human Genome Research Institute (NHGRI) GWAS Catalog.
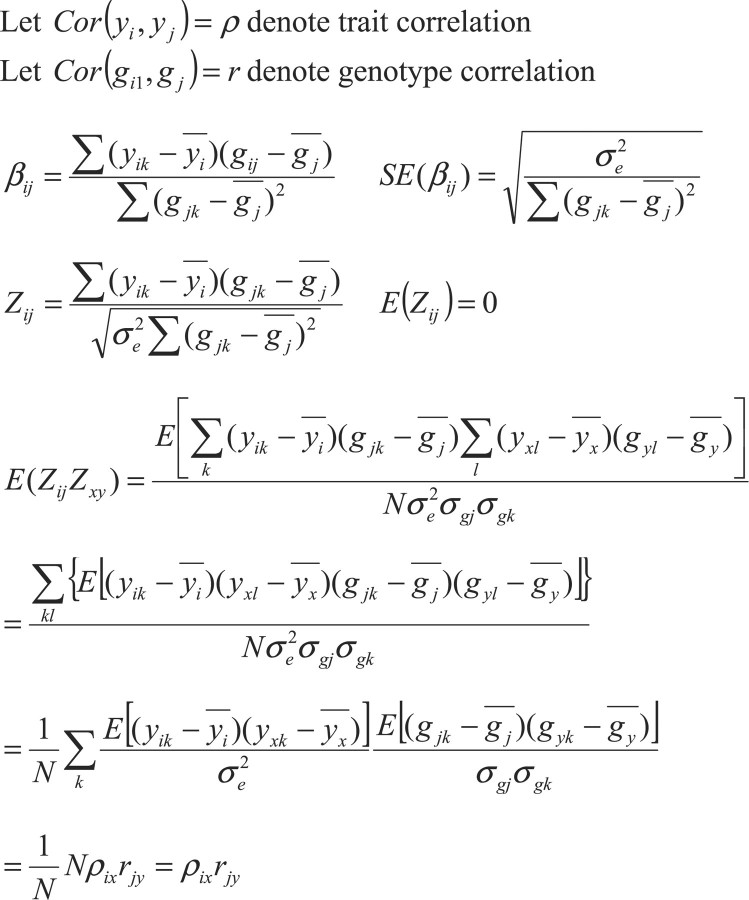
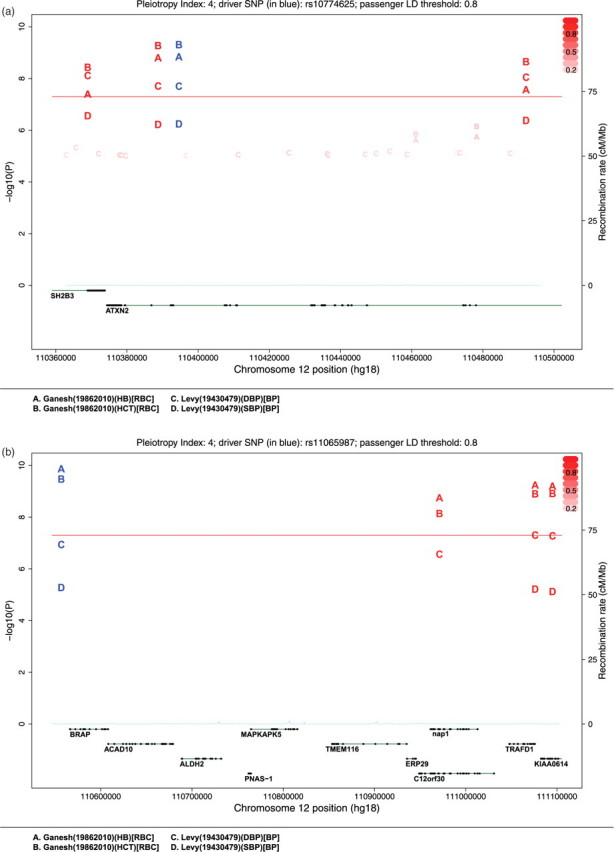
Results: By simulation, we identified pleiotropic regions including SH2B3 and BRAP (12q24.12) for hematologic and blood pressure traits. By approximation, we confirmed the genome-wide significant pleiotropy of these two regions based on the GWAS Catalog data, together with an exploration on other regions which highlights the FTO, GCKR and ABO regions.
Availability and implementation: The Perl and R scripts are available at http://www.framinghamheartstudy.org/research/gwas_pleiotropictool.html.
Figures