. 2011 Apr 20;30(8):1520-35.
doi: 10.1038/emboj.2011.63. Epub 2011 Mar 11.

Novel asymmetrically localizing components of human centrosomes identified by complementary proteomics methods

Affiliations

Novel asymmetrically localizing components of human centrosomes identified by complementary proteomics methods

Lis Jakobsen et al. EMBO J. .

Abstract

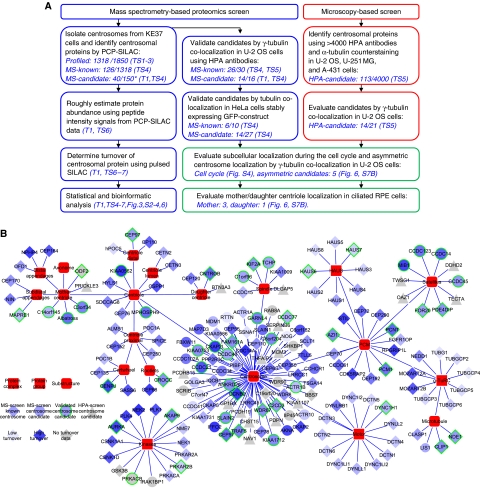
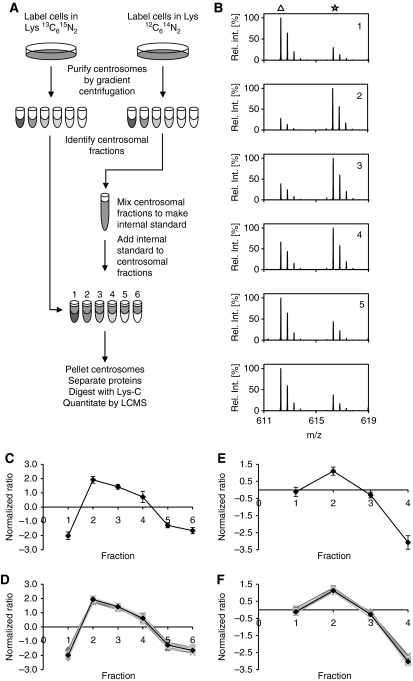
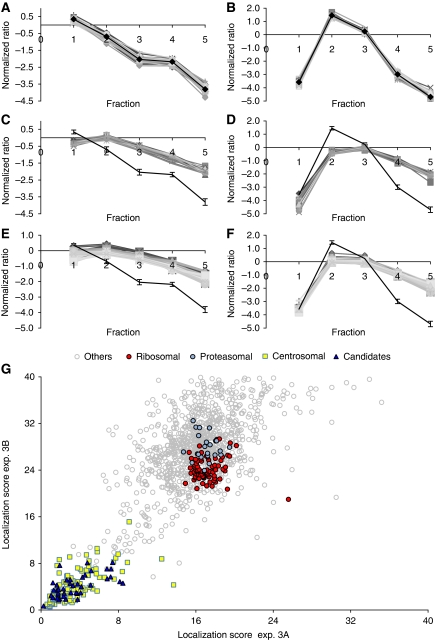
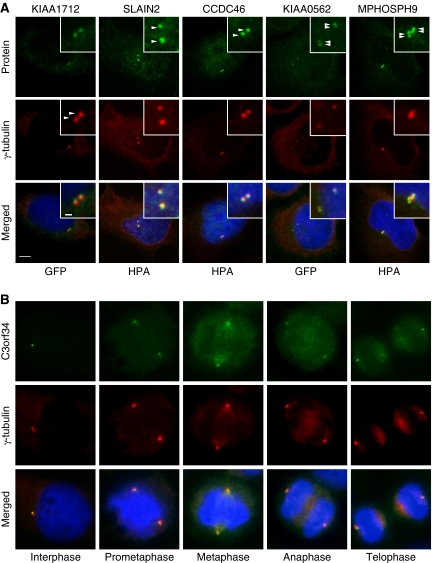
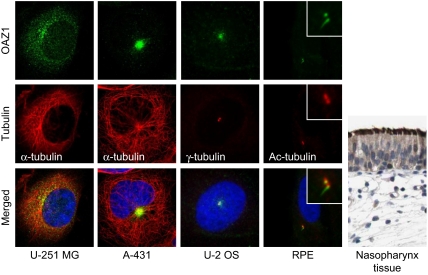
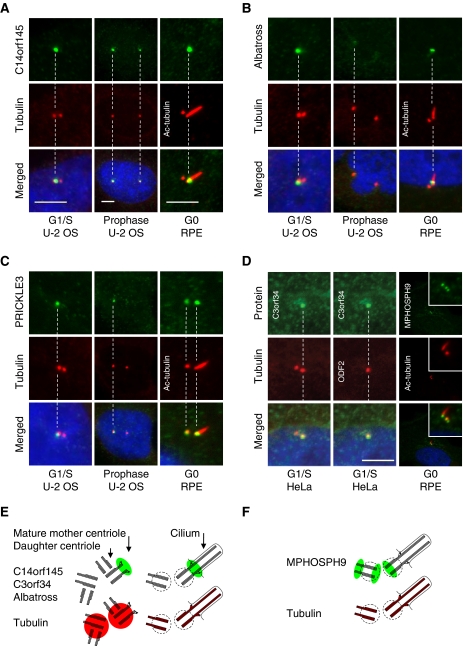
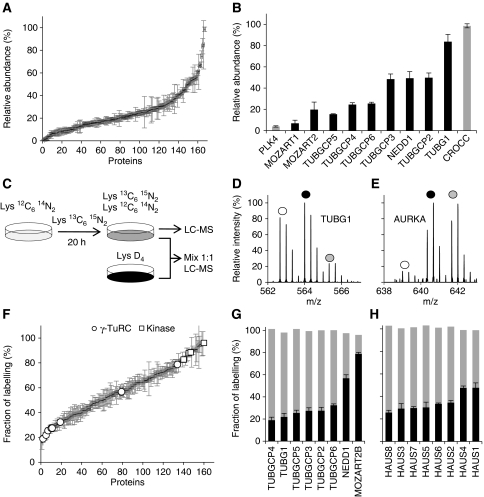
Centrosomes in animal cells are dynamic organelles with a proteinaceous matrix of pericentriolar material assembled around a pair of centrioles. They organize the microtubule cytoskeleton and the mitotic spindle apparatus. Mature centrioles are essential for biogenesis of primary cilia that mediate key signalling events. Despite recent advances, the molecular basis for the plethora of processes coordinated by centrosomes is not fully understood. We have combined protein identification and localization, using PCP-SILAC mass spectrometry, BAC transgeneOmics, and antibodies to define the constituents of human centrosomes. From a background of non-specific proteins, we distinguished 126 known and 40 candidate centrosomal proteins, of which 22 were confirmed as novel components. An antibody screen covering 4000 genes revealed an additional 113 candidates. We illustrate the power of our methods by identifying a novel set of five proteins preferentially associated with mother or daughter centrioles, comprising genes implicated in cell polarity. Pulsed labelling demonstrates a remarkable variation in the stability of centrosomal protein complexes. These spatiotemporal proteomics data provide leads to the further functional characterization of centrosomal proteins.


Conflict of interest statement

The authors declare that they have no conflict of interest.

Figures

Figure 1
Figure 1
Mapping the centrosome proteome. (A) Schematic outline of the mass spectrometry and microscopy-based screens carried out to identify and characterize candidate centrosomal proteins. In the MS-screen (left), centrosomal proteins were identified by the PCP-SILAC method (see Figure 2) and validated by co-localization experiments using antibodies and GFP-tagged proteins. In the HPA-screen (right), images of three different cell lines were evaluated for centrosomal staining using human protein atlas (HPA) antibodies. In follow-up experiments, we estimated the abundance, measured the turnover, and determined the subcellular localization of the identified proteins. The number of ‘profiled’ proteins refers to those quantified in all fractions out of those quantified in at least one fraction. The number of ‘MS-candidate’ and ‘MS-known’ refers to those annotated as novel or known centrosomal proteins, respectively, out of those scored as centrosomal proteins by the PCP-SILAC method (*) or those tested by microscopy. References to the relevant tables and figures are shown in brackets. (B) Dynamic protein localization network of the identified proteins. The network is manually curated using the software ‘Cytoscape’ and protein localization data extracted from this study and from the literature. The shape of the nodes indicates our classification of proteins as known or novel or identified by the MS-screen or the HPA-screen. The colour of the nodes indicates the percentage of metabolic isotope labelling after 20 h (protein turnover). A green node border indicates proteins validated in this study by fluorescence microscopy. For simplicity, each protein is shown with a single localization pattern.
Figure 2
Figure 2
Identification of centrosomal proteins by PCP-SILAC. (A) Schematic outline of the PCP-SILAC method used to distinguish centrosomal proteins from a background of co-purifying proteins. Centrosomes were isolated by sucrose gradient centrifugation from isotope-labelled and unlabelled cells. The six centrosome-containing fractions collected from the unlabelled cells were pooled to generate an internal standard, which was distributed into the six corresponding fractions collected from the labelled cells before processing these samples for MS analysis. (B) The enrichment of proteins relative to the internal standard is illustrated by the mass spectra of a single peptide (DFLQETVDEK) from the centrosomal protein CEP135 in fractions 1–6 where the peptide isotope clusters are marked by a triangle for signals representing the unlabelled internal standard (light isotope-labelled peptide) and by an asterisk for signals representing the sample in each fraction (heavy isotope-labelled peptide). (C) The enrichment profile of CEP135 was calculated from the isotope ratios shown in (B). (D) Profiles of 32 known centrosomal proteins and the resulting average consensus centrosomal profile. (E, F) Profiles of the DFLQETVDEK peptide from CEP135 and the consensus set of centrosomal proteins were determined from an independent experiment using only four fractions. The 32 proteins co-eluting in both experiments are included in Supplementary Tables S1 and S2).
Figure 3
Figure 3
Identification of centrosomal proteins by the double PCP-SILAC experiment. (A, B) Centrosomes were isolated by sucrose gradient centrifugation from three different isotope-labelled cell populations to profile the elution of proteins in two separate preparations simultaneously in a single experiment using one of the preparations as an internal standard (see outline of the double PCP-SILAC experiment in Supplementary Figure S1). The profiles for 32 known centrosomal proteins follow a narrow enrichment profile in both preparations and demonstrate that these proteins co-elute. The shape of the profiles is not critical for organelle classification but reflects a shift in the elution of proteins between the two experiments. (CF) The profiles of proteasomal and ribosomal subunits obtained from the same data set are distinct from the centrosomal consensus profiles. (G) An organelle classification score was calculated as the Mahalanobis distance between the centrosomal consensus profile and all other proteins with a complete enrichment profile in the double PCP-SILAC experiments 3A and 3B. Known centrosomal proteins and likely candidates clustered in a region with distance scores <9 as compared with, for example, proteasomal and ribosomal subunits with high distance scores.
Figure 4
Figure 4
Protein candidates identified by the MS-screen localize to the centrosome. (A) Co-staining with the centrosomal marker protein γ-tubulin (Cy3) support centrosome (two dots) or centriole (four dots) localization for the indicated candidates (green). Additional candidates validated as novel centrosomal proteins are listed in Table I and Supplementary Tables S4 and S5. (B) GFP–C3orf34 co-localize with γ-tubulin (Cy3) at all major stages of the cell cycle in HeLa cells. DNA was stained with DAPI, yellow indicates coincidence of green and red signals. Bars, 1 μm (insert) and 5 μm.
Figure 5
Figure 5
HPA-antibody screen in three different cell lines identify additional centrosomal proteins. Antibody staining of OAZ1 in U-251 MG, A-431, and U-2 OS cells suggests centrosome localization. Staining of OAZ1 in serum starved hTERT-RPE1 cells and nasopharynx tissue support basal body and cilia (primary and motile) localization. The centrosomal marker protein γ-tubulin (or α-tubulin) was stained with Cy3 and DNA with DAPI, yellow indicates coincidence of green and red signals. Bars, 5 μm. The immunohistochemical staining (brown–black) was counterstained with haematoxylin (blue colouring of both cells and extracellular material) to enable visualization of microscopic features.
Figure 6
Figure 6
Proteins identified by the MS- and the HPA-screen display asymmetric centrosome localization. (A) C14orf145, (B) Albatross, and (C) PRICKLE3 stain a single centrosome/centriole at the G1/S-phase of the cell cycle in U-2 OS cells as compared with the centrosomal marker protein γ-tubulin (Cy3). To distinguish between mother and daughter centriole association, the axoneme-extended mother centriole were stained with anti-acetylated tubulin (Cy3) in ciliated hTERT-RPE1 cells. This indicates that C14orf145 and Albatross localize to the mother centriole. (D) Antibody staining of GFP–C3orf34 in HeLa cells at the G1/S-phase and MPHOSPH9 in RPE cells at the G0 phase. Co-staining with the mother centriolar marker protein ODF2 (Cy5) indicates that GFP–C3orf34 associate with the mother centriole. Co-staining with anti-acetylated tubulin (red) in ciliated hTERT-RPE1 cells suggest that MPHOSPH9 (green) localize proximal at the mother centriole and distal and proximal at the daughter centriole. DNA was stained with DAPI, yellow indicates coincidence of green and red signals. Bars, 5 μm. (E, F) Interpretation of the staining patterns of tubulin (red) and asymmetrically localized candidate proteins (green) in duplicated centrosomes and basal bodies.
Figure 7
Figure 7
Abundance and turnover of centrosomal proteins are shown. (A) Rough estimates of protein abundance calculated from the averaged peptide intensities for known and candidate centrosomal proteins identified by PCP-SILAC (average of two experiments). (B) Relative protein abundance of selected centrosomal proteins. (C) Schematic outline of the pulsed-SILAC experiments to measure the turnover rate of centrosomal proteins. The experiment was performed in the absence and presence of a fully Lys-2H4-labelled internal standard. (D, E) Mass spectra of pulsed-labelled TUBG1 and AURKA peptides. White and grey circles indicate the old (light isotopes, L) and the newly synthesized pool (heavy isotopes, H) of proteins, respectively; dark circles indicate the internal standard (medium isotopes, M). (F) Turnover rates for known and candidate centrosomal proteins (average of two experiments). Highlighted proteins are the kinases PLK1, PLK4, AURKA, and NEK2, and the γ-TuRC subunits. (G, H) The turnover rates for the subunits of the γ-TuRC and HAUS complexes, respectively, are shown in black. Grey bars indicate the normalized sum of the old and newly synthesized pool of proteins (L/M+H/M), which provide a control for the measured ratio.

References

    1. Andersen JS, Mann M (2006) Organellar proteomics: turning inventories into insights. EMBO Rep 7: 874–879 - PMC - PubMed
    1. Andersen JS, Wilkinson CJ, Mayor T, Mortensen P, Nigg EA, Mann M (2003) Proteomic characterization of the human centrosome by protein correlation profiling. Nature 426: 570–574 - PubMed
    1. Anderson CT, Stearns T (2009) Centriole age underlies asynchronous primary cilium growth in mammalian cells. Curr Biol 19: 1498–1502 - PMC - PubMed
    1. Augustin A, Spenlehauer C, Dumond H, Menissier-De Murcia J, Piel M, Schmit AC, Apiou F, Vonesch JL, Kock M, Bornens M, De Murcia G (2003) PARP-3 localizes preferentially to the daughter centriole and interferes with the G1/S cell cycle progression. J Cell Sci 116: 1551–1562 - PubMed
    1. Barbe L, Lundberg E, Oksvold P, Stenius A, Lewin E, Bjorling E, Asplund A, Ponten F, Brismar H, Uhlen M, Andersson-Svahn H (2008) Toward a confocal subcellular atlas of the human proteome. Mol Cell Proteomics 7: 499–508 - PubMed

Publication types