. 2011 Feb 9;6(2):e16825.
doi: 10.1371/journal.pone.0016825.

Successful targeting and disruption of an integrated reporter lentivirus using the engineered homing endonuclease Y2 I-AniI

Affiliations

Successful targeting and disruption of an integrated reporter lentivirus using the engineered homing endonuclease Y2 I-AniI

Martine Aubert et al. PLoS One. .

Abstract

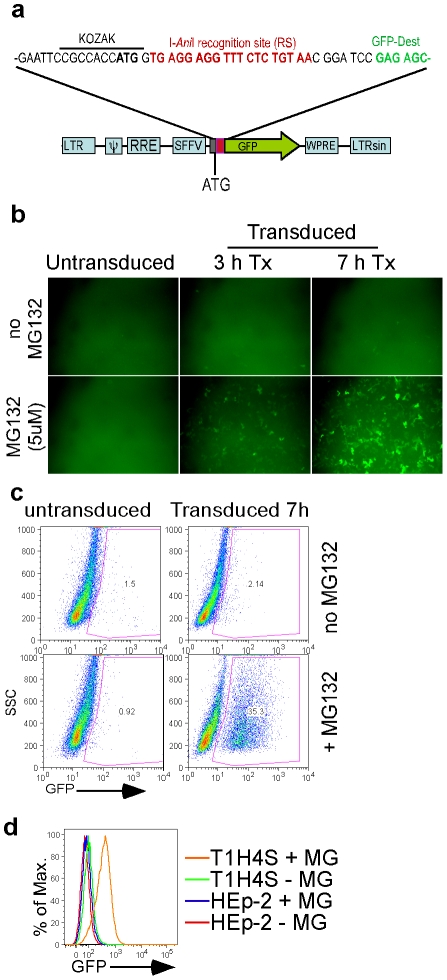
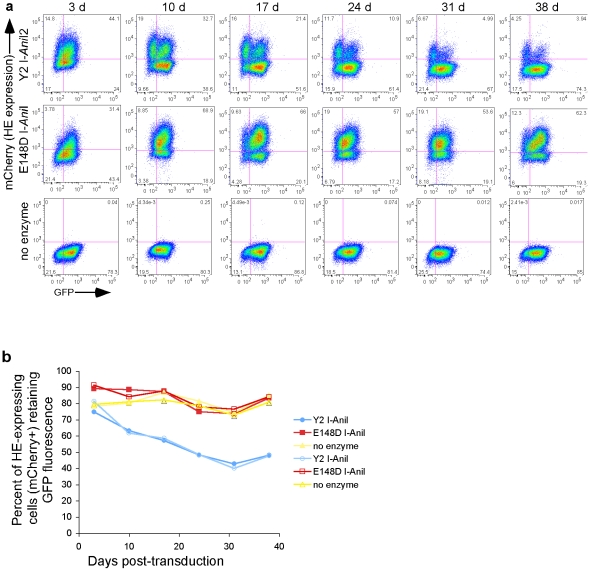
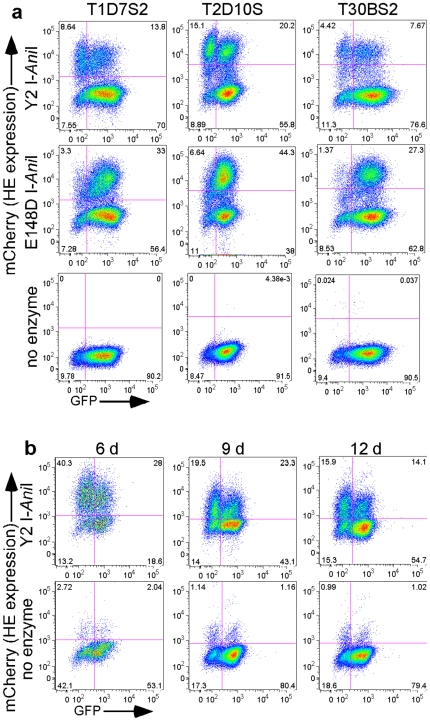
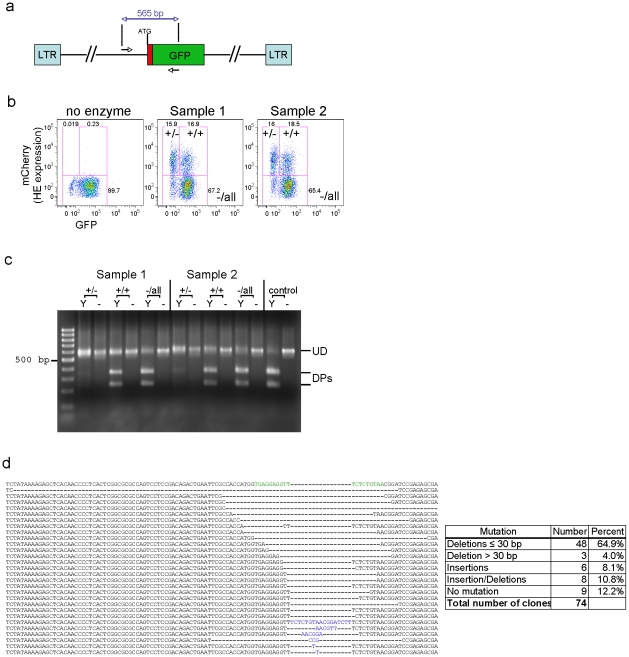
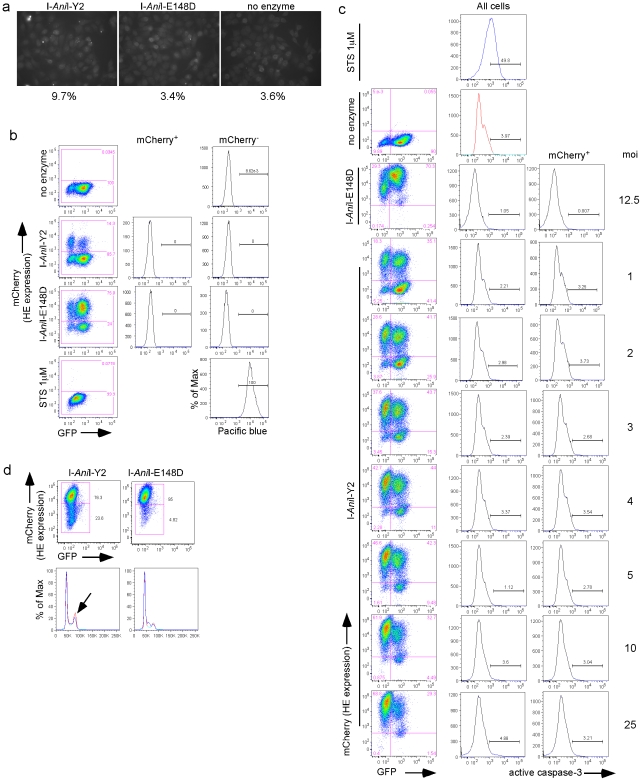
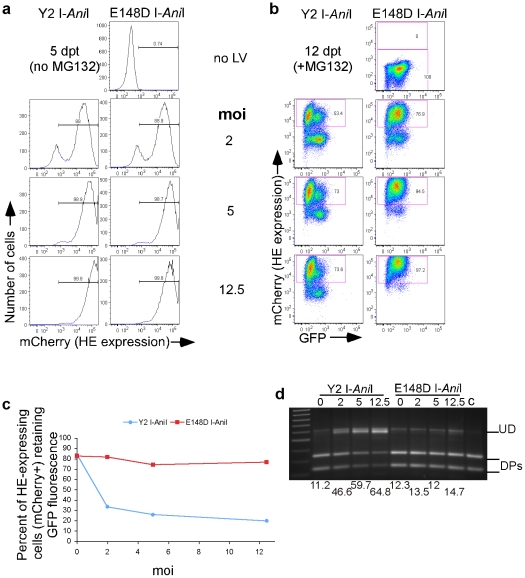
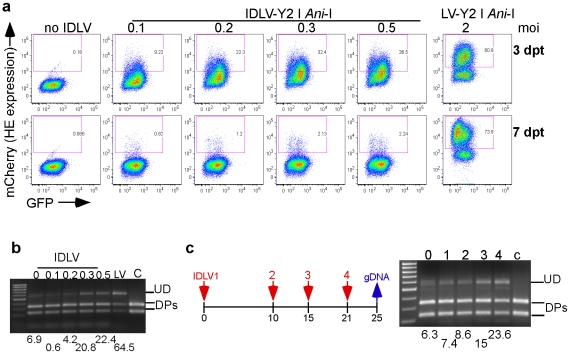
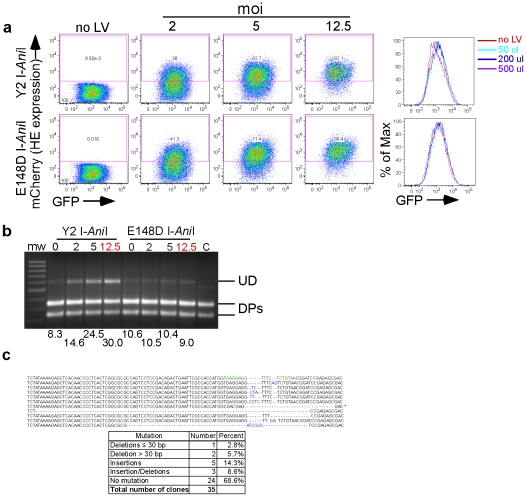
Current antiviral therapy does not cure HIV-infected individuals because the virus establishes lifelong latent infection within long-lived memory T cells as integrated HIV proviral DNA. Here, we report a new therapeutic approach that aims to cure cells of latent HIV infection by rendering latent virus incapable of replication and pathogenesis via targeted cellular mutagenesis of essential viral genes. This is achieved by using a homing endonuclease to introduce DNA double-stranded breaks (dsb) within the integrated proviral DNA, which is followed by triggering of the cellular DNA damage response and error-prone repair. To evaluate this concept, we developed an in vitro culture model of viral latency, consisting of an integrated lentiviral vector with an easily evaluated reporter system to detect targeted mutagenesis events. Using this system, we demonstrate that homing endonucleases can efficiently and selectively target an integrated reporter lentivirus within the cellular genome, leading to mutation in the proviral DNA and loss of reporter gene expression. This new technology offers the possibility of selectively disabling integrated HIV provirus within latently infected cells.


Conflict of interest statement

Competing Interests: The authors have declared that no competing interests exist.

Figures

Figure 1
Figure 1. Cell line with integrated reporter lentivirus vector.
(a) Schematic of the reporter lentivirus. (b) Immunofluorescence imaging of cells 3 days post transduction (dpt) with reporter lentivirus, with or without MG132 for 3 or 7 h. (c) Flow cytometry of the cells from panel b after 7 h treatment with MG132. (d) Flow cytometry of the clonal reporter (T1H4S) or parental (HEp-2) cell line after 5 h incubation with (+ MG) or without (−MG) 1 µM MG132.
Figure 2
Figure 2. Targeting reporter gene in integrated lentivirus for mutagenesis by the homing endonuclease Y2 I-AniI.
(a) Reporter (GFP) fluorescence and Y2 I-AniI expression (mCherry fluorescence) at the indicated days following transduction of the clonal reporter cell line T1H4S with lentiviral vector (moi of 2) expressing either the active enzyme Y2 I-AniI or the control inactive enzyme E148D I-AniI (as determined by mCherry expression), or control cells left untransduced (no enzyme, mCherry negative). This panel shows the data from one representative sample of a duplicate experiment. All cells were treated with 1 µM MG132 for 6 h prior to analysis. (b) Graphic representation of the data from the duplicate wells in the experiment depicted in Fig. 2a. Shown is the percent of the homing endonuclease-expressing cells (mCherry+ cell population) retaining reporter GFP fluorescence. The filled and open symbols correspond to the data from the duplicate wells. The percent of GFP+ cells was calculated as follows: {%GFP+ and mCherry+ cells x 100}/{Total % of mCherry+ cells}.
Figure 3
Figure 3. Targeting reporter gene in integrated lentivirus for mutagenesis using homing endonuclease in independent reporter cell lines.
(a) Flow cytometry analysis of two different clonal (T1D7S and T2D10S) and the bulk uncloned (T30BS2) reporter cell lines transduced with lentiviral vector (moi = 2) expressing either active Y2 I-AniI or inactive E148D I-AniI enzyme, or left untransduced (no enzyme). (b) Flow cytometry analysis of GFP fluorescence and Y2 I-AniI expression (mCherry fluorescence) at the indicated days following a second transduction of T1H4S cells with lentiviral vector expressing the active Y2 I-AniI enzyme (moi = 2). All cells were treated with 1 µM MG132 for 6 h prior to analysis.
Figure 4
Figure 4. Mutagenesis of the reporter gene in integrated lentivirus following exposure to Y2 I-AniI.
(a) Location of PCR primers used to amplify the I-AniI target site in reporter lentivirus integrated within cellular genomic DNA. (b) Three cell populations were sorted from T1H4S cells transduced with Y2 I-AniI expressing lentiviral vector at 17 dpt: Y2 I-AniI-expressing cells having retained (mCherry+; GFP+ or +/+) or lost (mCherry+; GFP or +/−) GFP expression, and cells negative for Y2 I-AniI expression (mCherry or −/all). (c) PCR amplicons from the sorted cell populations shown in (b) were either exposed (Y) to Y2 I-AniI enzyme in vitro or left unexposed (−). Full length undigested DNA (UD), digest products (DPs). The positive control consisted of PCR product directly amplified from reporter lentiviral vector DNA. (d) Sequence analysis of PCR amplicons from the sorted cell populations shown in (b). Left, representative mutated sequences. Top row shows wild type sequence with the I-AniI target site indicated in green. Nucleotide insertions are indicated in blue. Right, summary of sequences analyzed. (GenBank accession numbers: HQ416600 to HQ416674).
Figure 5
Figure 5. Analysis of the residual GFP+ cells after exposure to Y2 I-AniI.
(a) FACS of T1H4S cells transduced with Y2 I-AniI expressing lentiviral vector at 3 dpt, used in panels (panel b-e). (b) Flow cytometry and FACS analysis of the cells from (panel a) and maintained in culture up to 15 dpt. Two populations were sorted based on GFP fluorescence. (c) Y2 I-AniI digestion profiles of the PCR amplicons from cells in (panel b). Amplicons were either unexposed to (-) or exposed to (Y) Y2 I-AniI enzyme. Full length undigested DNA (UD), digest products (DPs), control: PCR product from reporter lentiviral vector DNA. (d) Summary of sequence analysis of the target region in GFP- cells (GenBank accession numbers: HQ416556 to HQ416599). (e). Sequence analysis of the target region in GFP+ cells (e, left) and DNA mutations detected in the GFP+ population (e, right). Top row corresponds to the wild type sequence with the I-AniI target site indicated in green. Nucleotide insertions are indicated in blue. (GenBank accession numbers: HQ416445 to HQ416555).
Figure 6
Figure 6. Lack of homing endonuclease toxicity.
(a) Immunofluorescence images of cells stained for γ-H2AX. Nuclei were counterstained with DAPI. At least 330 cells were scored for the presence of foci under a 40X objective. (b) Live/dead analysis of cells 35 dpt. Left column, flow cytometric analysis for reporter GFP fluorescence and HE expression (mCherry fluorescence). The histograms from the middle (mCherry+ cells only) and right (mCherry cells only) columns show the results of the live/dead analysis; dead cells with compromised membranes stain with the amine-reactive fluorescent dye (Pacific blue). Positive control cells treated overnight with 1 µM staurosporine (STS, a cell death inducer) are shown in the bottom row. (c) Flow cytometry analysis for activated caspase-3. T1H4S cells were transduced at the indicated moi with lentiviral vector expressing either active Y2 I-AniI or inactive E148D I-AniI enzyme. At 3 dpt, cells were split into duplicate wells and assayed for cell death. One well for each condition was used for flow cytometric analysis of reporter GFP fluorescence and HE expression (mCherry fluorescence) after 6 h treatment with MG132. The second well of cells was used to assay for apoptosis by caspase-3 staining as described in Material & Methods. The positive control for apoptosis was obtained by treating T1H4S cells left unexposed to HE-expressing lentivirus with 1 µM staurosporine STS overnight. The left column shows the GFP and mCherry fluorescence analysis, and the middle (total cell population) and right (mCherry+ cells only) columns present the results of the caspase-3 analysis for each condition. (d) Cell cycle analysis of T1H4S cells transduced with lentiviral vector expressing either active Y2 I-AniI or inactive E148D I-AniI enzyme for 6 days, sorted for mCherry expression, and kept for 22 more days in culture. Cells were not treated with MG132 prior to staining and flow cytometry analysis. Blue, mCherry cells; red mCherry+. Arrow indicates the increased delay in G2 among cells exposed to Y2 I-AniI.
Figure 7
Figure 7. Mutagenesis of the reporter gene in integrated lentivirus following exposure to increasing amount of Y2 I-AniI.
(a) Y2 I-AniI expression (mCherry fluorescence) at 5 dpt and (b) reporter GFP fluorescence and Y2 I-AniI expression (mCherry fluorescence) at 12 dpt of the reporter cell line T1H4S transduced with the indicated moi of lentiviral vector expressing either active Y2 I-AniI or inactive E148D I-AniI enzyme. The experiments in Fig. 2 6 used LV-Y2 I-AniI and LV-E148D I-AniI at a moi of 2. (c) Graphic representation of the percent of homing endonuclease-expressing cells (mCherry+ cell population) having retained GFP fluorescence. The percent of GFP+ cells was calculated as follows: {%GFP+ and mCherry+ cells x 100}/{Total % of mCherry+ cells}. (d)Y2 I-AniI digestion profiles of the PCR amplicons containing the Y2 I-AniI target region from the unsorted cell populations of panel (b). Full length undigested DNA (UD), digest products (DPs). Numbers below the figure represent percent of undigested full length DNA remaining after Y2 I-AniI digestion.
Figure 8
Figure 8. Mutagenesis of the reporter gene in integrated lentivirus following transient exposure to Y2 I-AniI.
(a) Reporter GFP fluorescence and Y2 I-AniI expression (mCherry fluorescence) at 3 and 7 dpt of the reporter cell line T1H4S transduced with the indicated moi of non integrating (IDLV) or integrating (LV) lentiviral vector expressing active Y2 I-AniI enzyme, (b) Y2 I-AniI digestion profiles of PCR amplicons containing the Y2 I-AniI target region obtained with the 7 dpt unsorted cells shown in panel (a). Numbers below the figure represent percent of undigested full length DNA remaining after Y2 I-AniI digestion. In (b) and (c), full length undigested DNA (UD), digest products (DPs); the positive control (“C”) consisted of PCR product directly amplified from reporter lentiviral vector DNA. (c) Left, transduction schedule of the reporter cell line T1H4S with non integrating (IDLV) Y2 I-AniI expressing lentiviral vector at an moi of 0.5. Red arrows indicate the transduction time points and the blue arrow the time of gDNA isolation from the unsorted cell populations. Right, Y2 I-AniI digestion profiles of the PCR amplicons containing the Y2 I-AniI target region from the unsorted cell populations at day 25. Numbers below the figure represent percent of undigested full length DNA remaining after Y2 I-AniI digestion.
Figure 9
Figure 9. Mutagenesis of the integrated lentivirus reporter gene in T cells following exposure to Y2 I-AniI.
(a) Reporter GFP fluorescence and Y2 I-AniI expression (mCherry fluorescence) at 13 dpt of a Jurkat T reporter cell line transduced with the indicated moi of lentiviral vector expressing either active Y2 I-AniI or inactive E148D I-AniI enzyme. Right panels show the overlaid GFP fluorescence histograms of the cells expressing the enzyme (mCherry+ cells from the dot plots on the left side). The no LV histograms correspond to the mCherry negative population. (b) Y2 I-AniI digestion profiles of the PCR amplicons containing the Y2 I-AniI target region obtained from the unsorted cells from panel (a). Full length undigested DNA (UD), digest products (DPs). The positive control (“C”) consisted of PCR product directly amplified from reporter lentivirus. (c) Sequence analysis of PCR amplicons from cells transduced at an moi of 12.5 from panel (a–b). Nucleotide insertions are indicated in blue. (GenBank accession numbers: HQ432772 to HQ432804).

References

    1. Lehrman G, Hogue IB, Palmer S, Jennings C, Spina CA, et al. Depletion of latent HIV-1 infection in vivo: a proof-of-concept study. Lancet. 2005;366:549–555. - PMC - PubMed
    1. Siliciano JD, Lai J, Callender M, Pitt E, Zhang H, et al. Stability of the latent reservoir for HIV-1 in patients receiving valproic acid. J Infect Dis. 2007;195:833–836. - PubMed
    1. Chevalier BS, Stoddard BL. Homing endonucleases: structural and functional insight into the catalysts of intron/intein mobility. Nucleic Acids Res. 2001;29:3757–3774. - PMC - PubMed
    1. Marcaida MJ, Munoz IG, Blanco FJ, Prieto J, Montoya G. Homing endonucleases: from basics to therapeutic applications. Cell Mol Life Sci. 2010;67:727–748. - PMC - PubMed
    1. Paques F, Duchateau P. Meganucleases and DNA double-strand break-induced recombination: perspectives for gene therapy. Curr Gene Ther. 2007;7:49–66. - PubMed

Publication types

MeSH terms