. 2011 Aug;12(4):423-35.
doi: 10.1007/s10162-011-0259-2. Epub 2011 Mar 12.

Gene expression gradients along the tonotopic axis of the chicken auditory epithelium

Affiliations

Gene expression gradients along the tonotopic axis of the chicken auditory epithelium

Corey S Frucht et al. J Assoc Res Otolaryngol. 2011 Aug.

Abstract

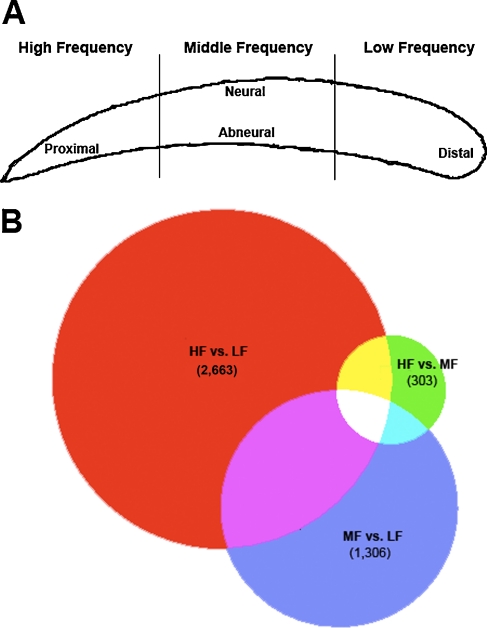
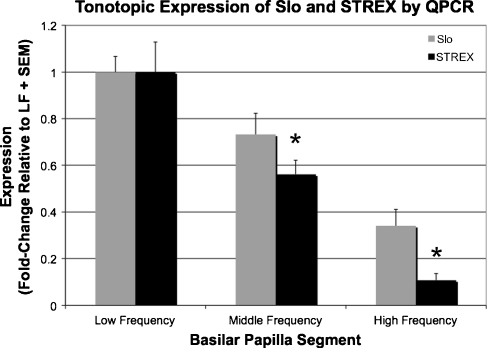
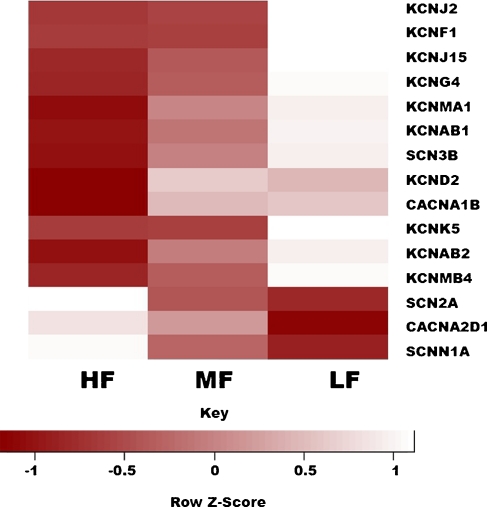
There are known differences in the properties of hair cells along the tonotopic axis of the avian auditory epithelium, the basilar papilla (BP). To determine the genetic basis of these differences, we compared gene expression between the high- (HF), middle-, and low-frequency (LF) thirds of 0-day-old chick auditory epithelia. RNA amplified from each sample was hybridized to whole-genome chicken arrays and GeneSpring software was used to identify differentially expressed genes. Two thousand six hundred sixty-three genes were found to be differentially expressed between the HF and LF segments, using a fold-change cutoff of 2 and a p value of 0.05. Many ion channel genes were differentially expressed between the HF and LF regions of the BP, an expression pattern that was previously established for some but not all of these genes. Quantitative PCR was used to verify tonotopic expression of 15 genes, including KCNMA1 (Slo) and its alternatively spliced STREX exon. Gene set enrichment analyses (GSEA) were performed on the microarray data and revealed many microRNA gene sets significantly enriched in the HF relative to the LF end, suggesting a tonotopic activity gradient. GSEA also suggested differential activity of the kinases protein kinase C and protein kinase A at the HF and LF ends, an interesting corollary to the observation that there is tonotopic expression of the STREX exon that confers on Slo sensitivity to the activity of kinases. Taken together, these results suggest mechanisms of induction and maintenance of tonotopicity and enhance our understanding of the complex nature of proximal-distal gene expression gradients in the chicken BP.


Figures

FIG. 1
FIG. 1
Shown in panel A is a schematic diagram showing the manner in which the auditory epithelia were sectioned. Low-, middle-, and high-frequency segments were pooled as described in the text to allow for comparison of genome-wide expression across the three indicated regions. Shown in panel B is a proportional Venn diagram representing overlap of differentially expressed genes for the high- versus low-frequency (HF vs. LF; 2,663), high- versus middle-frequency (HF vs. MF; 303), and middle- versus low-frequency (MF vs. LF; 1,306) comparisons. Far more genes are differentially expressed between the HF and LF segments than either of the middle-frequency comparisons, suggesting that many of the HF vs. LF genes are expressed in a gradient along the tonotopic axis of the basilar papilla.
FIG. 2
FIG. 2
Slo and the Slo exon STREX are transcribed tonotopically. Shown are the relative expression levels of both Slo and its alternatively spliced STREX exon in the low- (LF, n = 3), middle- (MF, n = 3), and high-frequency (HF, n = 4) segments of the post-hatch chicken basilar papilla as determined by qPCR. Expression levels were normalized first to 18S expression, then respectively to Slo and STREX expression levels in the LF segment. A clear tonotopic gradient can be appreciated for both Slo and STREX with expression that significantly decreased from the LF region to the HF region (one-way ANOVA, p < 0.05). The fold-change differences of LF versus MF and LF versus HF were significantly different between STREX and Slo, indicating a steeper gradient for STREX than for Slo (t tests, p < 0.05).
FIG. 3
FIG. 3
Many ion channels are expressed in a gradient along the tonotopic axis of the chicken basilar papilla. Shown is a heat map showing normalized expression levels in the high- (HF), middle- (MF), and low-frequency (LF) segments of the basilar papilla for 15 ion channel genes. The depicted expression values are all normalized relative to the average for each row (i.e., the average expression for a particular gene across all three segments). As shown in the color key, light rectangles represent higher expression levels than dark rectangles. Most of the genes shown appear to be expressed in a gradient along the tonotopic axis.

References

    1. Affymetrix I (2004) Eukaryotic sample and array processing. GeneChip expression analysis technical manual. Santa Clara, CA, Affymetrix, Inc. 701021 Rev. 5:2.1.3–2.3.18
    1. Affymetrix I (2009) GeneChip. Expression analysis technical manual.
    1. Art JJ, Crawford AC, et al. Electrical resonance and membrane currents in turtle cochlear hair cells. Hear Res. 1986;22:31–36. doi: 10.1016/0378-5955(86)90073-0. - DOI - PubMed
    1. Art JJ, Wu YC, et al. The calcium-activated potassium channels of turtle hair cells. J Gen Physiol. 1995;105(1):49–72. doi: 10.1085/jgp.105.1.49. - DOI - PMC - PubMed
    1. Bai C-X, Giamarchi A, et al. Formation of a new receptor-operated channel by heteromeric assembly of TRPP2 and TRPC1 subunits. EMBO Rep. 2008;9(5):472–479. doi: 10.1038/embor.2008.29. - DOI - PMC - PubMed

Publication types

MeSH terms

Substances