. 2011 Apr;53(4):1270-81.
doi: 10.1002/hep.24194. Epub 2011 Mar 11.

Interaction between Toll-like receptors and natural killer cells in the destruction of bile ducts in primary biliary cirrhosis

Affiliations

Interaction between Toll-like receptors and natural killer cells in the destruction of bile ducts in primary biliary cirrhosis

Shinji Shimoda et al. Hepatology. 2011 Apr.

Abstract

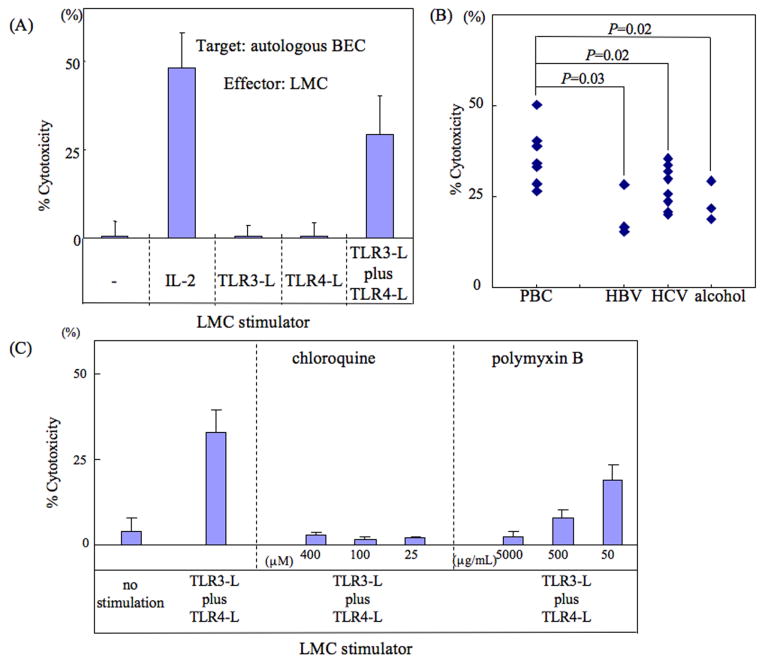
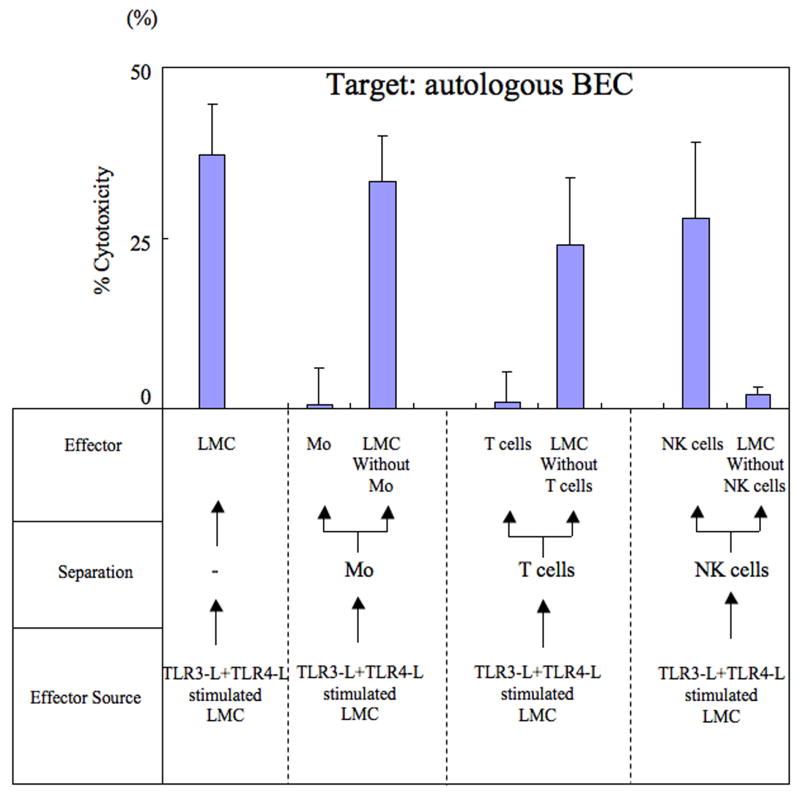
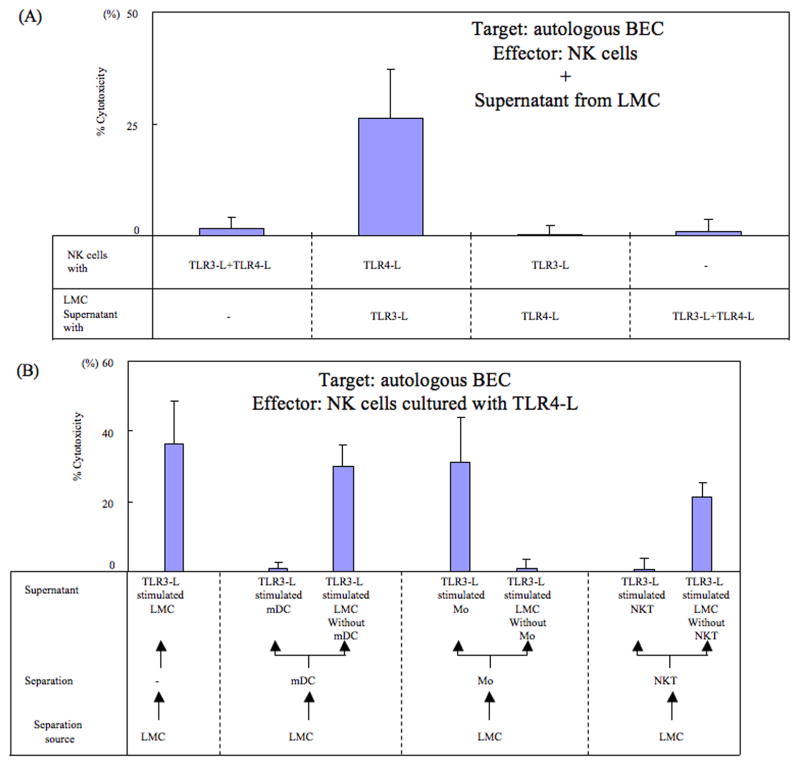
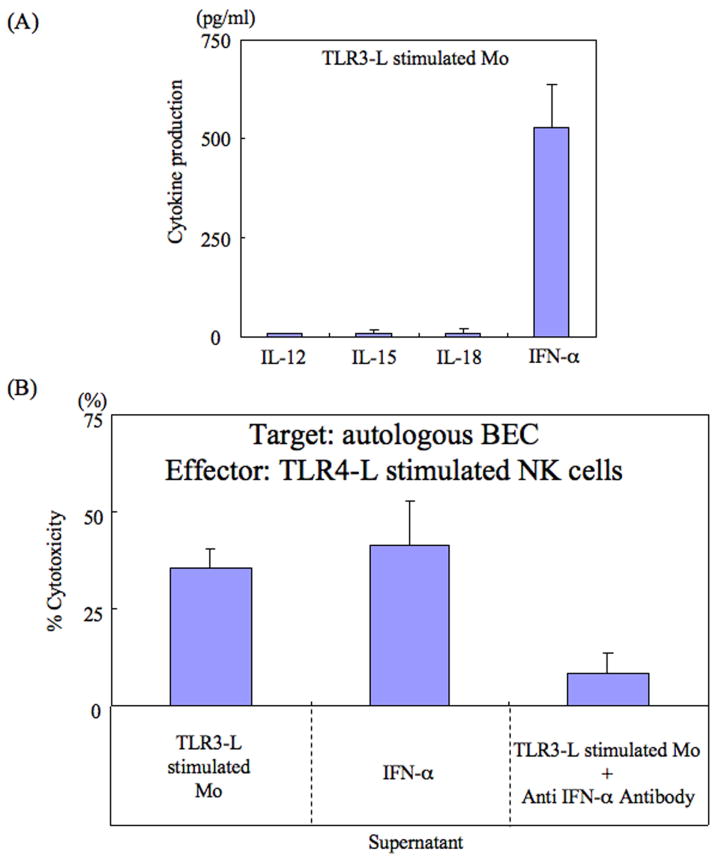
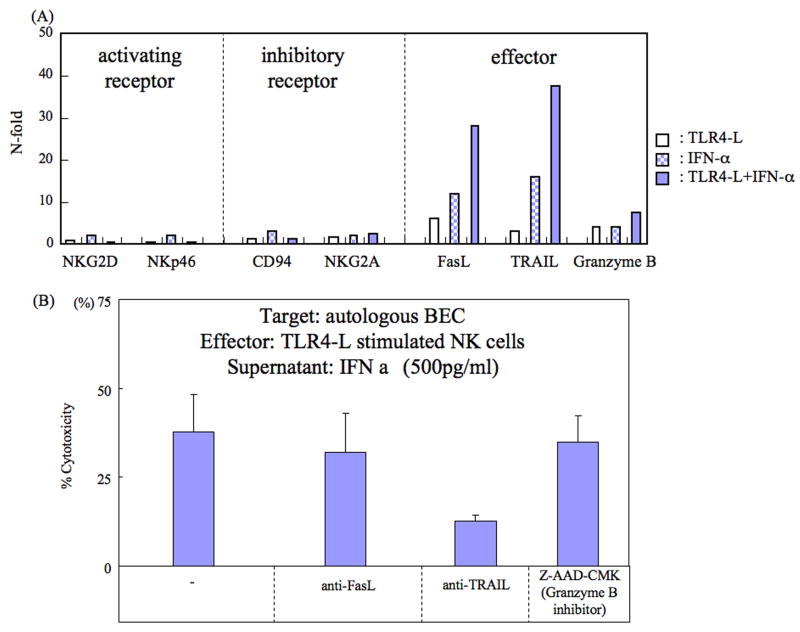
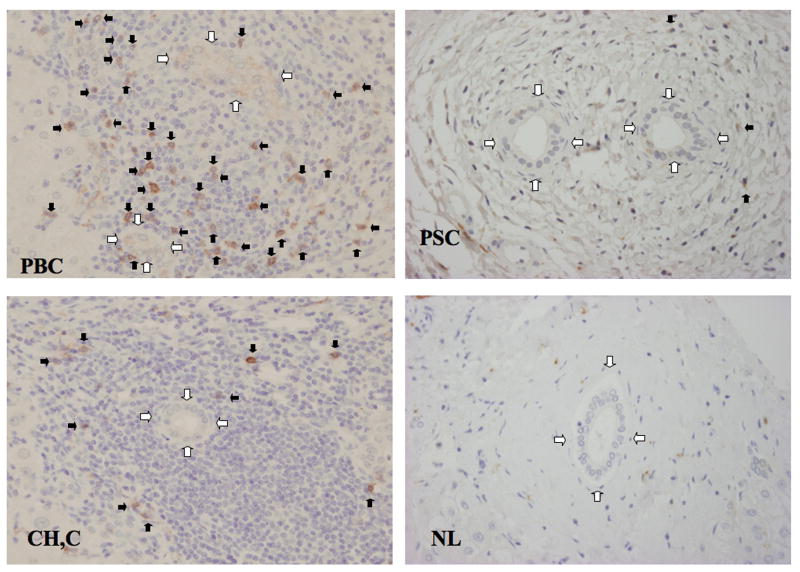
Primary biliary cirrhosis (PBC) is characterized by chronic nonsuppurative destructive cholangitis (CNSDC) associated with destruction of small bile ducts. Although there have been significant advances in the dissection of the adaptive immune response against the mitochondrial autoantigens, there are increasing data that suggest a contribution of innate immune mechanisms in inducing chronic biliary pathology. We have taken advantage of our ability to isolate subpopulations of liver mononuclear cells (LMC) and examined herein the role of Toll-like receptors (TLRs), their ligands, and natural killer (NK) cells in modulating cytotoxic activity against biliary epithelial cells (BECs). In particular, we demonstrate that Toll-like receptor 4 ligand (TLR4-L)-stimulated NK cells destroy autologous BECs in the presence of interferon alpha (IFN-α) synthesized by TLR 3 ligand (TLR3-L)-stimulated monocytes (Mo). Indeed, IFN-α production by hepatic Mo is significantly increased in patients with PBC compared to disease controls. There were also marked increases in the cytotoxic activity of hepatic NK cells from PBC patients compared to NK cells from controls but only when the NK cells were prepared following ligation of both TLR3-L- and TLR4-L-stimulated LMC. These functional data are supported by the immunohistochemical observation of an increased presence of CD56-positive NK cells scattered around destroyed small bile ducts more frequently in liver tissues from PBC patients than controls.

Conclusion: These data highlight critical differences in the varied roles of Mo and NK cells following TLR3-L and TLR4-L stimulation.


Figures

Figure 1
Figure 1
(A) In vitro activation requirements of LMC for cytotoxicity against BEC. LMC isolated from 8 patients with PBC and 14 control patients were cultured in vitro with either IL-2, TLR3-L alone, TLR4-L alone or a mixture of TLR3-L + TLR4-L for 3 days and then washed and assayed for cytotoxicity against autologous BEC using the standard 51Cr release assay. LMC cultured in media alone served as a negative control. The assay was performed in triplicate for each activation agent and expressed as mean +/- S.D. Representative data from one PBC patient is shown. (B) The net cytotoxicity for LMC against BEC was performed. There were statistical differences in the degree of net cytotoxicity induced by TLR3-L and TLR4-L activation of LMC in cells from PBC when compared to other control liver diseases. (C) The use of inhibitors of the TLR3 and TLR4 signaling pathways on the cytotoxicity of activated LMC against autologous BEC. LMC from 8 PBC patients and 14 control patients were activated in vitro with TLR3-L + TLR4-L in the presence of various concentrations of either chloroquine (TLR3 pathway inhibitor) or polymyxin B (TLR4 pathway inhibitor) and tested for cytotoxicity against autologous BEC. The left panel shows the control cytotoxicity data of LMC cultured in media alone or following activation with TLR3-L and TLR4-L. The middle and right panels reflect data obtained on aliquots of the same LMC activated using TLR3-L and TLR4-L but cultured in the presence of chloroquine or polymyxin B, respectively. Each culture was performed in triplicate and the data shown are mean +/- S.D. The data shown are from one PBC patient but is representative.
Figure 2
Figure 2
Identification of the cell lineage within LMC that mediate cytotoxicity against autologous BEC. Cultures of LMC were activated in vitro with TLR3-L and TLR4-L and then aliquots assayed for cytotoxicity against autologous BEC (control) or used to isolate or deplete specific cell lineages. Thus, LMC were either enriched for Mo or depleted of Mo, enriched for T cells or depleted of T cells and enriched for NK cells or depleted of NK cells and each of these tested for cytotoxicity against autologous BEC. Results of mean cytotoxicity (mean +/- S.D.) of data obtained on one PBC patient is displayed.
Figure 3
Figure 3
A. The activation requirements of NK cells in mediating cytotoxicity against autologous BEC. Highly enriched population of NK cells were cultured in vitro in the presence of (i) TLR3-L+TLR4-L, (ii) TLR4-L and supernatant fluid from LMC cultured in the presence of TLR3-L, (iii) TLR3-L and supernatant fluid from LMC cultured in the presence of TLR4-L and (iv) supernatant fluids from LMC cultured in the presence of TLR3-L+TLR4-L. Cultures were performed in triplicate and the mean +/- S.D. of the net % cytotoxicity calculated. The data shown are from one PBC patient and is representative. B. Identification of the cell lineage that is the source of the factor required to mediate cytotoxicity of autologous BEC by TLR4-L activated NK cells. A pool of a highly enriched population of NK cells was cultured with TLR4-L in the presence of supernatant fluids from a) unfractionated LMC cultured with TLR3-L (control), b) highly enriched populations of mDC or LMC depleted of mDC stimulated with TLR3-L, c) highly enriched population of Mo or LMC depleted of Mo stimulated with TLR3-L and d) highly enriched population of NKT cells to LMC depleted of NKT cells stimulated with TLR3-L. These cultures were tested for cytotoxicity against autologous BEC. Each culture was performed in triplicate and the data shown reflect mean +/- S.D. of net % cytotoxicity of the triplicate cultures. The data shown are from one PBC patient and is representative.
Figure 4
Figure 4
(A) Analysis of cytokines synthesized by in vitro TLR3-L activated hepatic Mo. Mo from the liver of the 22 patients included in the present study were isolated and cultured in vitro and the supernatant fluids analyzed for levels of IL-12, IL-15, IL-18 and IFN-α. Cultures were performed in triplicate and the data displayed represents mean +/- S.D. of values obtained from cultures from one representative patient. Statistical differences between PBC patients and disease controls are described in the text. (B) IFN-α is required by TLR4-L stimulated NK cells to mediate cytotoxicity against autologous BEC. Aliquots of TLR4-L stimulated NK cells were cultured in the presence of either supernatant fluids from TLR3-L stimulated hepatic Mo (control), IFN-α, or supernatant fluids from TLR3-L stimulated Mo incubated with previously determined optimum concentration of anti-IFN-α monoclonal antibody. Cultures were performed in triplicate and assayed for cytotoxicity against autologous BEC. Data displayed are net % cytotoxicity and the data shown are from one representative PBC patient.
Figure 5
Figure 5
A. Expression of activating receptor, inhibitory receptor and effectors based upon TLR4-L, IFN-α or a combination of TLR4-L and IFN-α stimulation. Activating receptors and inhibitory receptors were not expressed following stimulation from TLR4-L, IFN-α or their combination. Effectors such as FasL, TRAIL and Granzyme B were synergistically expressed dependent on the stimulation. Data displayed are from one representative PBC patient. B. Contribution of TRAIL to liver NK cell cytotoxicity against autologous BEC. Aliquots of NK cells were cultured in the presence of TLR4-L and 500 pg/ml of IFN-α alone (control) or with the addition of pre-determined optimum concentrations of anti-FAS-L, anti-TRAIL or Z-AAD-CMK (inhibitor of Granzyme B) and then assayed for cytotoxicity against autologous BEC. Cultures were performed in triplicate and the data displayed reflects net % cytotoxicity expressed as mean +/- S.D. of the triplicate cultures. The data shown are from one PBC patient and is representative.
Figure 6
Figure 6
Immunohistochemistry of CD56 positive cells in liver. Mononuclear cells expressing CD56 are seen in the biliary epithelial layer and periductal tissue. In PBC, CD56+ cells are seen within the biliary epithelium (black arrow) and also at high density around the bile ducts (white arrow). In PSC and hepatitis C, CD56+ cells are scattered, and in normal liver CD56+ cells are rare around the bile ducts. Statistical differences between PBC patients and controls are described in the text.

Comment in

References

    1. Gershwin ME, Ansari AA, Mackay IR, Nakanuma Y, Nishio A, Rowley MJ, Coppel RL. Primary biliary cirrhosis: an orchestrated immune response against epithelial cells. Immunol Rev. 2000;174:210–225. - PubMed
    1. Kaplan MM, Gershwin ME. Primary biliary cirrhosis. N Engl J Med. 2005;353:1261–1273. - PubMed
    1. Lleo A, Selmi C, Invernizzi P, Podda M, Coppel RL, Mackay IR, Gores GJ, et al. Apotopes and the biliary specificity of primary biliary cirrhosis. Hepatology. 2009;49:871–879. - PMC - PubMed
    1. McNally RJ, Ducker S, James OF. Are transient environmental agents involved in the cause of primary biliary cirrhosis? Evidence from space-time clustering analysis. Hepatology. 2009;50:1169–1174. - PubMed
    1. Lleo A, Bowlus C, Yang G-X, Invernizzi P, Podda M, Van de Water J, Ansari A, et al. Biliary apotopes and anti-mitochondrial antibodies activate innate immune responses in primary biliary cirrhosis. Hepatology. 2010;52:987–998. - PMC - PubMed

MeSH terms