. 2011 Nov;50(11):884-900.
doi: 10.1002/mc.20757. Epub 2011 Mar 11.

Functional characterization of peroxisome proliferator-activated receptor-β/δ expression in colon cancer

Affiliations

Functional characterization of peroxisome proliferator-activated receptor-β/δ expression in colon cancer

Jennifer E Foreman et al. Mol Carcinog. 2011 Nov.

Abstract

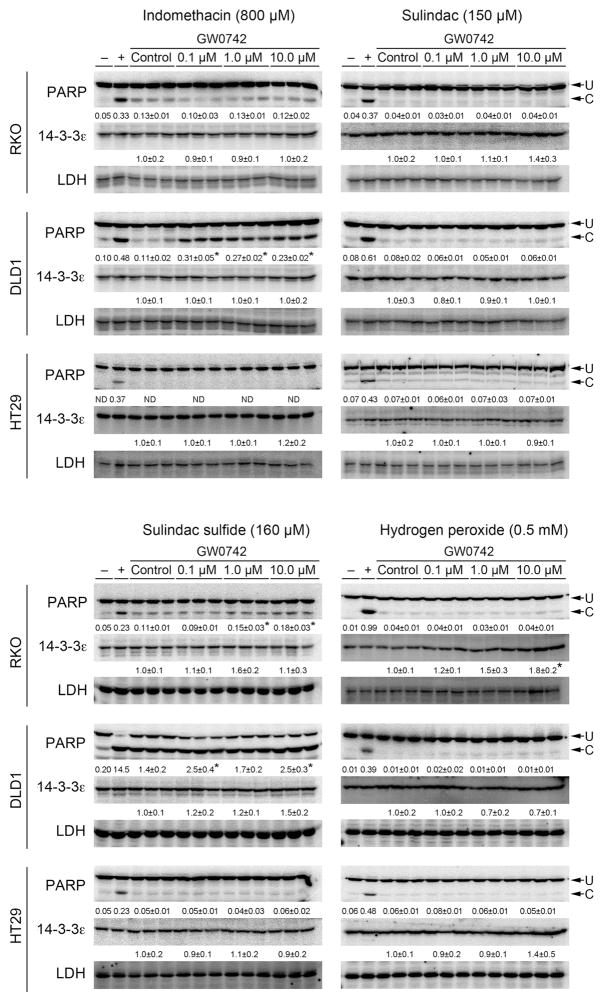
This study critically examined the role of PPARβ/δ in colon cancer models. Expression of PPARβ/δ mRNA and protein was lower and expression of CYCLIN D1 protein higher in human colon adenocarcinomas compared to matched non-transformed tissue. Similar results were observed in colon tumors from Apc(+/Min-FCCC) mice compared to control tissue. Dietary administration of sulindac to Apc(+/Min-FCCC) mice had no influence on expression of PPARβ/δ in normal colon tissue or colon tumors. Cleaved poly (ADP-ribose) polymerase (PARP) was either increased or unchanged, while expression of 14-3-3ε was not influenced in human colon cancer cell lines cultured with the PPARβ/δ ligand GW0742 under conditions known to increase apoptosis. While DLD1 cells exhibited fewer early apoptotic cells after ligand activation of PPARβ/δ following treatment with hydrogen peroxide, this change was associated with an increase in late apoptotic/necrotic cells, but not an increase in viable cells. Stable over-expression of PPARβ/δ in human colon cancer cell lines enhanced ligand activation of PPARβ/δ and inhibition of clonogenicity in HT29 cells. These studies are the most quantitative to date to demonstrate that expression of PPARβ/δ is lower in human and Apc(+/Min-FCCC) mouse colon tumors than in corresponding normal tissue, consistent with the finding that increasing expression and activation of PPARβ/δ in human colon cancer cell lines inhibits clonogenicity. Because ligand-induced attenuation of early apoptosis can be associated with more late, apoptotic/necrotic cells, but not more viable cells, these studies illustrate why more comprehensive analysis of PPARβ/δ-dependent modulation of apoptosis is required in the future.


Figures

Figure 1
Figure 1
Expression of PPARβ/δ protein and mRNA is lower in human colon tumors compared to matched control tissue. (A) Representative quantitative western blot of PPARβ/δ, PPARγ and CYLCIN D1 expression in normal colon or rectal tissue and colon or rectal tumors. A total of nineteen colon tumors or matched control colon tissue from the same patient, or fourteen rectal tumors or matched rectal tissue from the same patient were examined. + = positive control: lysate from COS1 cells transfected with human PPARβ/δ, or in vitro translated human PPARγ1. Values were normalized to ACTIN. Values represent the mean ± S.E.M. from all independent samples. Values with different superscripts are significantly different at P ≤ 0.05. (B) Quantitative realtime PCR was performed to measure expression of mRNA encoding PPARβ/δ. Normalized values were calculated from the independent samples described in (A) and represent the mean ± S.E.M. from all independent samples. Comparisons were made between normal tissue and both colon and rectal tumors combined (left panel), or by tumor type (right panel). (C) The ratio of relative PPARβ/δ mRNA between tumor and matched control tissue was calculated and log transformed. *Statistically lower in tumors as compared to matched tissue control, P ≤ 0.05.
Figure 2
Figure 2
Expression of PPARβ/δ and PPARγ protein and mRNA in colon and colon tumors from wild-type and APC+/Min-FCCC mice. (A) Tissue extracts were prepared from colon (normal and tumor) from wild-type or APC+/Min-FCCC mice fed either a control diet or one containing sulindac as described in the Materials and Methods. Representative western blots were performed to measure expression of PPARβ/δ, PPARγ or CYCLIN D1 and normalized to ACTIN. + = positive control: lysate from COS1 cells transfected with mouse PPARβ/δ expression vector or, in vitro translated mouse PPARγ1. A total of nine independent samples per group were examined. Arrow indicates immunoreactive band for PPARγ1 (B) Quantitative realtime PCR was performed to measure expression of mRNA encoding Pparβ/δ or Pparγ1 and normalized to Gapdh mRNA. Normalized values were calculated from the nine independent samples described in (A) and represent the mean ± S.E.M. from all independent samples. Values within a row with different superscripts are significantly different at P ≤ 0.05.
Figure 3
Figure 3
Effect of ligand activation of PPARβ/δ on markers of apoptosis in human colon cancer cell lines following induction of apoptosis by NSAIDs or hydrogen peroxide. Human colon cancer cell lines (RKO-wild-type APC/β-CATENIN, DLD1 and HT29-constitutively active APC/β-CATENIN) were cultured with the indicated concentrations of GW0742 and 800 μM indomethacin (upper left panel), 150 μM sulindac (upper right panel), 160 μM sulindac sulfide (lower left panel), or 0.5 mM hydrogen peroxide (lower right panel). For indomethacin, sulindac and sulindac sulfide treatment, cells were cultured for 24 h and whole cell lysates prepared at the end of this treatment period. For hydrogen peroxide treatment, cells were cultured for 4 h and whole cell lysates prepared at the end of this treatment period. Cells cultured without the NSAID, hydrogen peroxide or GW0742 served as a negative control (−). Cells cultured without the NSAID, hydrogen peroxide or GW0742 but in the presence of 2 μM staurosporine for 5 h served as a positive control (+). Expression of uncleaved (U) and cleaved (C) PARP and 14-3-3ε was measured by quantitative western blots. The immunoreactive signals for uncleaved PARP, cleaved PARP or 14-3-3ε were normalized to the immunoreactive signals for LDH. PARP expression is shown as the ratio of the normalized values of cleaved/uncleaved PARP and is presented as the mean ± S.E.M. Normalized 14-3-3ε expression is shown as the fold change as compared to control cells for each respective group and is presented as the mean ± S.E.M.. A total of at least three independent samples were examined for each treatment except for the negative and positive controls. *Significantly different from control (NSAID-treated without GW0742) at P ≤ 0.05. ND=cleaved PARP not detected.
Figure 4
Figure 4
Modulation of hydrogen peroxide-induced apoptosis and cell viability following ligand activation of PPARβ/δ. (A) RKO, (B) DLD1, or (C) HT29 human colon cancer cell lines were cultured to approximately 80% confluency and then pretreated for 1 h with either 0.02% DMSO (control), or GW0742 (0.1, 1.0, and 10 μM). Cells were then treated for 4 h in medium containing either 0.0, 0.5, or 5.0 mM hydrogen peroxide in the presence of the indicated concentration of GW0742. Apoptosis and viability was determined by flow cytometry after labeling with propidium iodide and a FITC-labeled anti-annexin V antibody. Viable cells were defined as the percentage of cells that were annexin V-negative and PI-negative. Early apoptosis was defined as the percentage of cells that were annexin V-positive and PI-negative, and late apoptosis/necrosis was defined as the percentage of cells that were annexin V-negative and PI-positive or annexin V-positive and PI-positive. The percentage of cells within each category was calculated as described in the Materials and Methods. Values represent the mean ± S.E.M. from at least three independent samples. #Significantly different from untreated control at P ≤ 0.05. *Significantly different from respective control at P ≤ 0.05.
Figure 5
Figure 5
Characterization of stable human colon cancer cell lines over-expressing PPARβ/δ. (A) Human colon cancer cell lines (RKO, DLD1 and HT29) were used to generate stable cell lines over-expressing PPARβ/δ and eGFP as described in Materials and Methods. Representative photomicrographs using phase contrast microscopy (upper panels) or fluorescence (lower panels) of control (parent cell line), cells stably expressing the Migr1-empty vector (Migr1), or cells stably expressing PPARβ/δ (hPPARβ/δ). (B) Quantitative western blots were performed to measure expression of PPARβ/δ in control (parent cell line), cells stably expressing the Migr1-empty vector (Migr1), or cells stably expressing PPARβ/δ (hPPARβ/δ). Values represent PPARβ/δ expression normalized to LDH control as compared to control cells. (C) Quantitative realtime PCR was performed to determine the effect of ligand activation of PPARβ/δ by GW0742 in control (parent cell line), cells stably expressing the Migr1-empty vector (Migr1), or cells stably expressing PPARβ/δ (hPPARβ/δ). Normalized ADRP or ANGPTL4 mRNA were measured as markers of PPARβ/δ transcriptional activity. *Significantly different from respective control at P ≤ 0.05.
Figure 6
Figure 6
Effect of ligand activation of PPARβ/δ on colony formation in human colon cancer cell lines over-expressing PPARβ/δ. Control (parent RKO cell line), RKO cells stably expressing the Migr1-empty vector (Migr1), or RKO cells stably expressing PPARβ/δ (Migr1-hPPARβ/δ) were plated at 300 cells per well. After allowing the cells to adhere for 24 h, cells were treated with medium containing either: 0 (DMSO control), 0.1, 1.0 or 10 μM GW0742. Plating efficiency (%) was 32 ± 1, 48 ± 6, and 55 ± 1 for parent RKO, Migr1 and Migr1-hPPARβ/δ cells, respectively. The surviving fraction was calculated after colony number was quantified using Image J software (version 1.37, National Institutes of Health, Bethesda, MD). The surviving fraction is presented as the mean ± S.E.M.. *Significantly different from control, P < 0.05. #Significantly different from control, P < 0.01. †Significantly different from control, P < 0.001.
Figure 7
Figure 7
Effect of ligand activation of PPARβ/δ on colony formation in human colon cancer cell lines over-expressing PPARβ/δ. Control (parent DLD1 cell line), DLD1 cells stably expressing the Migr1-empty vector (Migr1), or DLD1 cells stably expressing PPARβ/δ (Migr1-hPPARβ/δ) were plated at 400 cells per well. After allowing the cells to adhere for 8 h, cells were treated with medium containing either: 0 (DMSO control), 0.1, 1.0 or 10 μM GW0742. Plating efficiency (%) was 20 ± 1, 27 ± 2, and 24 ± 2 for parent DLD1, Migr1 and Migr1-hPPARβ/δ cells, respectively. The surviving fraction was calculated after colony number was quantified using Image J software (version 1.37, National Institutes of Health, Bethesda, MD). The surviving fraction is presented as the mean ± S.E.M.. #Significantly different from control, P < 0.01.
Figure 8
Figure 8
Effect of ligand activation of PPARβ/δ on colony formation in human colon cancer cell lines over-expressing PPARβ/δ. Control (parent HT29 cell line), HT29 cells stably expressing the Migr1-empty vector (Migr1), or HT29 cells stably expressing PPARβ/δ (Migr1-hPPARβ/δ) were plated at 600 cells per well. After allowing the cells to adhere for 8 h, cells were treated with medium containing either: 0 (DMSO control), 0.1, 1.0 or 10 μM GW0742. Plating efficiency (%) was 20 ± 1, 25 ± 2, and 27 ± 2 for parent HT29, Migr1 and Migr1-hPPARβ/δ cells, respectively. The surviving fraction was calculated after colony number was quantified using Image J software (version 1.37, National Institutes of Health, Bethesda, MD). The surviving fraction is presented as the mean ± S.E.M.. #Significantly different from control, P < 0.01. †Significantly different from control, P < 0.001.

Similar articles

Cited by

References

    1. Burdick AD, Kim DJ, Peraza MA, Gonzalez FJ, Peters JM. The role of peroxisome proliferator-activated receptor-β/δ in epithelial cell growth and differentiation. Cell Signal. 2006;18(1):9–20. - PubMed
    1. Peters JM, Gonzalez FJ. Sorting out the functional role(s) of peroxisome proliferator-activated receptor-β/δ (PPARβ/δ) in cell proliferation and cancer. Biochim Biophys Acta. 2009;1796(2):230–241. - PMC - PubMed
    1. Peters JM, Hollingshead HE, Gonzalez FJ. Role of peroxisome-proliferator-activated receptor β/δ (PPARβ/δ) in gastrointestinal tract function and disease. Clin Sci (Lond) 2008;115(4):107–127. - PMC - PubMed
    1. Berglund L, Bjorling E, Oksvold P, et al. A genecentric Human Protein Atlas for expression profiles based on antibodies. Mol Cell Proteomics. 2008;7(10):2019–2027. - PubMed
    1. Escher P, Braissant O, Basu-Modak S, Michalik L, Wahli W, Desvergne B. Rat PPARs: quantitative analysis in adult rat tissues and regulation in fasting and refeeding. Endocrinology. 2001;142(10):4195–4202. - PubMed

Publication types