

Secondary flow as a mechanism for the formation of biofilm streamers
- PMID: 21402020
- PMCID: PMC3059581
- DOI: 10.1016/j.bpj.2011.01.065
Secondary flow as a mechanism for the formation of biofilm streamers
Erratum in
- Biophys J. 2011 Jun 22;100(12):3054
Abstract
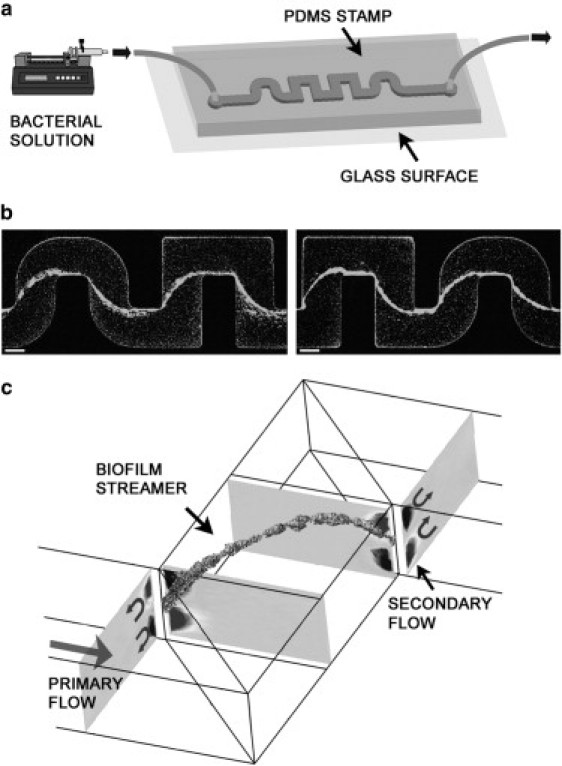
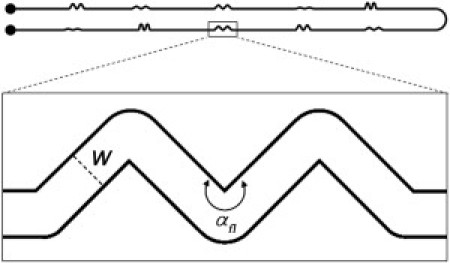
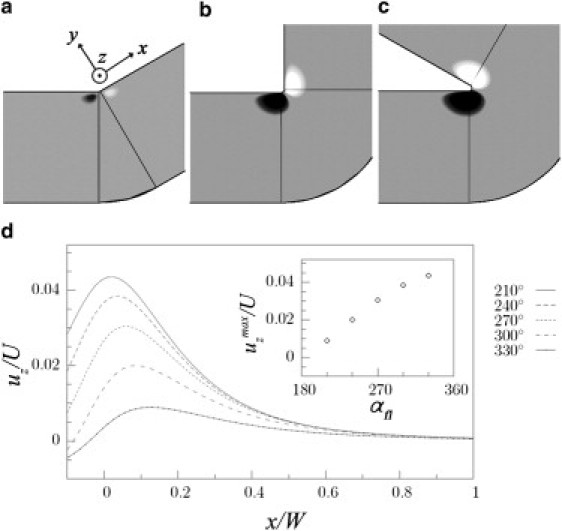
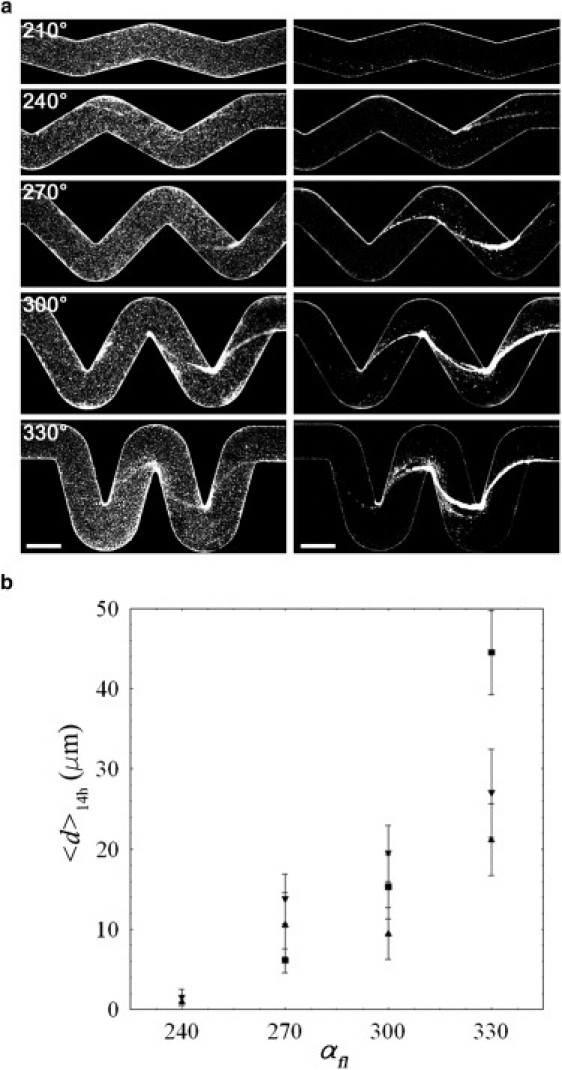
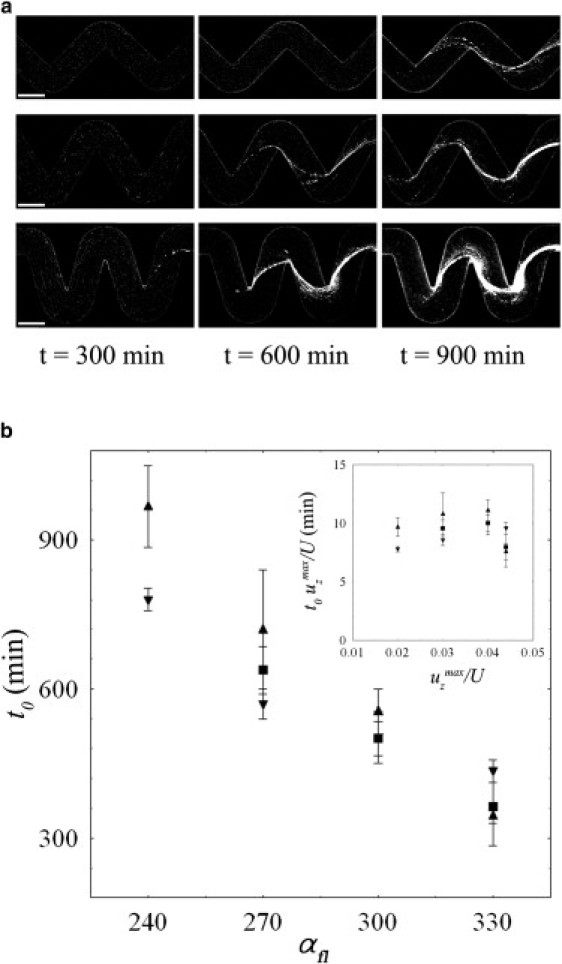
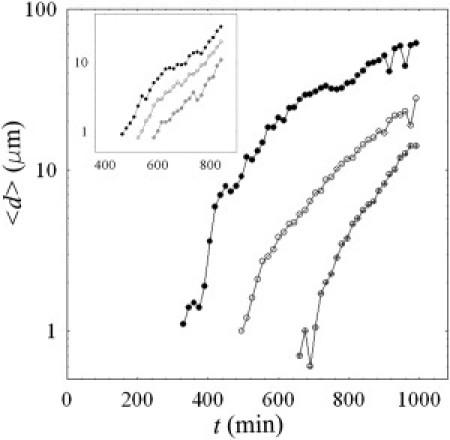
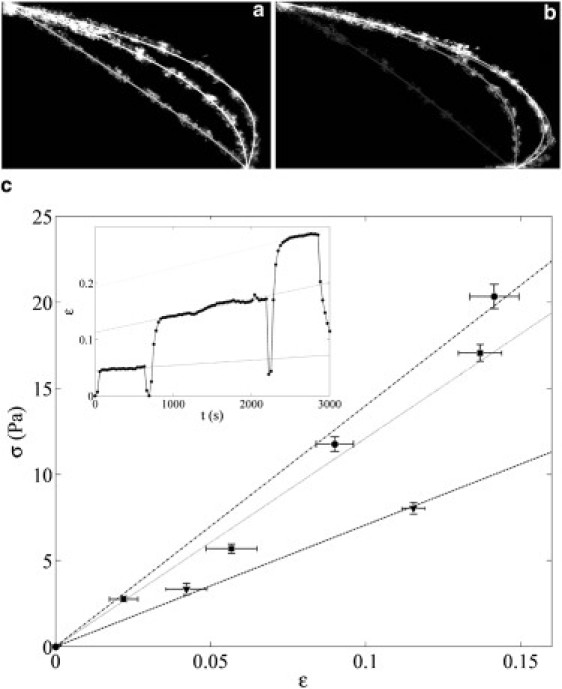
In most environments, such as natural aquatic systems, bacteria are found predominantly in self-organized sessile communities known as biofilms. In the presence of a significant flow, mature multispecies biofilms often develop into long filamentous structures called streamers, which can greatly influence ecosystem processes by increasing transient storage and cycling of nutrients. However, the interplay between hydrodynamic stresses and streamer formation is still unclear. Here, we show that suspended thread-like biofilms steadily develop in zigzag microchannels with different radii of curvature. Numerical simulations of a low-Reynolds-number flow around these corners indicate the presence of a secondary vortical motion whose intensity is related to the bending angle of the turn. We demonstrate that the formation of streamers is directly proportional to the intensity of the secondary flow around the corners. In addition, we show that a model of an elastic filament in a two-dimensional corner flow is able to explain how the streamers can cross fluid streamlines and connect corners located at the opposite sides of the channel.
Copyright © 2011 Biophysical Society. Published by Elsevier Inc. All rights reserved.
Figures

Similar articles
-
Interplay of physical mechanisms and biofilm processes: review of microfluidic methods.Lab Chip. 2015 Jan 7;15(1):23-42. doi: 10.1039/c4lc01095g. Lab Chip. 2015. PMID: 25385289 Free PMC article. Review.
-
Laminar flow around corners triggers the formation of biofilm streamers.J R Soc Interface. 2010 Sep 6;7(50):1293-9. doi: 10.1098/rsif.2010.0096. Epub 2010 Mar 31. J R Soc Interface. 2010. PMID: 20356880 Free PMC article.
-
Bacterial streamers as colloidal systems: Five grand challenges.J Colloid Interface Sci. 2021 Jul 15;594:265-278. doi: 10.1016/j.jcis.2021.02.102. Epub 2021 Mar 9. J Colloid Interface Sci. 2021. PMID: 33765646 Review.
-
A web of streamers: biofilm formation in a porous microfluidic device.Lab Chip. 2012 Dec 21;12(24):5133-7. doi: 10.1039/c2lc40815e. Lab Chip. 2012. PMID: 23123600
-
Formation and post-formation dynamics of bacterial biofilm streamers as highly viscous liquid jets.Sci Rep. 2014 Nov 20;4:7126. doi: 10.1038/srep07126. Sci Rep. 2014. PMID: 25410423 Free PMC article.
Cited by
-
Dynamics of Pseudomonas putida biofilms in an upscale experimental framework.J Ind Microbiol Biotechnol. 2018 Oct;45(10):899-911. doi: 10.1007/s10295-018-2070-0. Epub 2018 Aug 21. J Ind Microbiol Biotechnol. 2018. PMID: 30132198
-
A Microfluidic Chip for Studies of the Dynamics of Antibiotic Resistance Selection in Bacterial Biofilms.Front Cell Infect Microbiol. 2022 May 10;12:896149. doi: 10.3389/fcimb.2022.896149. eCollection 2022. Front Cell Infect Microbiol. 2022. PMID: 35619647 Free PMC article.
-
Interplay of physical mechanisms and biofilm processes: review of microfluidic methods.Lab Chip. 2015 Jan 7;15(1):23-42. doi: 10.1039/c4lc01095g. Lab Chip. 2015. PMID: 25385289 Free PMC article. Review.
-
Mass transfer enhancement in moving biofilm structures.Biophys J. 2012 Apr 4;102(7):1483-92. doi: 10.1016/j.bpj.2012.02.033. Epub 2012 Apr 3. Biophys J. 2012. PMID: 22500748 Free PMC article.
-
A microfluidic platform for characterizing the structure and rheology of biofilm streamers.Soft Matter. 2022 May 25;18(20):3878-3890. doi: 10.1039/d2sm00258b. Soft Matter. 2022. PMID: 35535650 Free PMC article.
References
-
- Costerton J.W., Lewandowski Z., Lappin-Scott H.M. Microbial biofilms. Annu. Rev. Microbiol. 1995;49:711–745. - PubMed
-
- Townsin R.L. The ship hull fouling penalty. Biofouling. 2003;19(Suppl):9–15. - PubMed
-
- Flemming H.C. Biofouling in water systems—cases, causes and countermeasures. Appl. Microbiol. Biotechnol. 2002;59:629–640. - PubMed
-
- Zimmerli W., Trampuz A., Ochsner P.E. Prosthetic joint infections. N. Engl. J. Med. 2004;351:1645–1654. - PubMed
Publication types
MeSH terms
LinkOut - more resources
Full Text Sources
Other Literature Sources
