

Spreading dynamics of biomimetic actin cortices
- PMID: 21402021
- PMCID: PMC3059579
- DOI: 10.1016/j.bpj.2011.01.038
Spreading dynamics of biomimetic actin cortices
Abstract
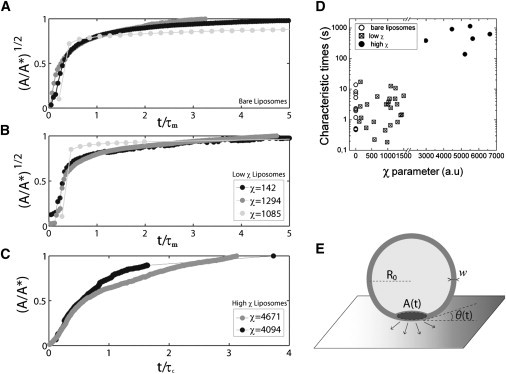
Reconstituted systems mimicking cells are interesting tools for understanding the details of cell behavior. Here, we use an experimental system that mimics cellular actin cortices, namely liposomes developing an actin shell close to their inner membrane, and we study their dynamics of spreading. We show that depending on the morphology of the actin shell inside the liposome, spreading dynamics is either reminiscent of a bare liposome (in the case of a sparse actin shell) or of a cell (in the case of a continuous actin shell). We use a mechanical model that qualitatively accounts for the shape of the experimental curves. From the data on spreading dynamics, we extract characteristic times that are consistent with mechanical estimates. The mechanical characterization of such stripped-down experimental systems paves the way for a more complex design closer to a cell. We report here the first step in building an artificial cell and studying its mechanics.
Copyright © 2011 Biophysical Society. Published by Elsevier Inc. All rights reserved.
Figures
Similar articles
-
Mechanics of Biomimetic Liposomes Encapsulating an Actin Shell.Biophys J. 2015 Dec 15;109(12):2471-2479. doi: 10.1016/j.bpj.2015.10.050. Biophys J. 2015. PMID: 26682806 Free PMC article.
-
Reconstitution of an actin cortex inside a liposome.Biophys J. 2009 Jan;96(1):192-8. doi: 10.1016/j.bpj.2008.09.029. Biophys J. 2009. PMID: 19134475 Free PMC article.
-
Cell-sized liposomes that mimic cell motility and the cell cortex.Methods Cell Biol. 2015;128:271-85. doi: 10.1016/bs.mcb.2015.01.013. Epub 2015 Apr 8. Methods Cell Biol. 2015. PMID: 25997352
-
Active probing of the mechanical properties of biological and synthetic vesicles.Biochim Biophys Acta Gen Subj. 2021 Apr;1865(4):129486. doi: 10.1016/j.bbagen.2019.129486. Epub 2019 Nov 14. Biochim Biophys Acta Gen Subj. 2021. PMID: 31734458 Review.
-
Mechanics of the cellular actin cortex: From signalling to shape change.Curr Opin Cell Biol. 2020 Oct;66:69-78. doi: 10.1016/j.ceb.2020.05.008. Epub 2020 Jun 21. Curr Opin Cell Biol. 2020. PMID: 32580115 Review.
Cited by
-
Cell-sized liposomes reveal how actomyosin cortical tension drives shape change.Proc Natl Acad Sci U S A. 2013 Oct 8;110(41):16456-61. doi: 10.1073/pnas.1221524110. Epub 2013 Sep 24. Proc Natl Acad Sci U S A. 2013. PMID: 24065829 Free PMC article.
-
Transformation of actoHMM assembly confined in cell-sized liposome.Langmuir. 2011 Sep 20;27(18):11528-35. doi: 10.1021/la2016287. Epub 2011 Aug 24. Langmuir. 2011. PMID: 21819144 Free PMC article.
-
F-actin architecture determines the conversion of chemical energy into mechanical work.Nat Commun. 2024 Apr 24;15(1):3444. doi: 10.1038/s41467-024-47593-x. Nat Commun. 2024. PMID: 38658549 Free PMC article.
-
In vitro studies of actin filament and network dynamics.Curr Opin Cell Biol. 2013 Feb;25(1):6-13. doi: 10.1016/j.ceb.2012.11.007. Epub 2012 Dec 22. Curr Opin Cell Biol. 2013. PMID: 23267766 Free PMC article. Review.
-
Model systems for studying cell adhesion and biomimetic actin networks.Beilstein J Nanotechnol. 2014 Aug 1;5:1193-202. doi: 10.3762/bjnano.5.131. eCollection 2014. Beilstein J Nanotechnol. 2014. PMID: 25161853 Free PMC article. Review.
References
Publication types
MeSH terms
Substances
LinkOut - more resources
Full Text Sources
