Enhanced glucose 6-phosphatase activity in liver of rats exposed to Mg(2+)-deficient diet
- PMID: 21402051
- PMCID: PMC3081387
- DOI: 10.1016/j.abb.2011.03.003
Enhanced glucose 6-phosphatase activity in liver of rats exposed to Mg(2+)-deficient diet
Abstract
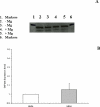
Total hepatic Mg(2+) content decreases by >25% in animals maintained for 2 weeks on Mg(2+) deficient diet, and results in a >25% increase in glucose 6-phosphatase (G6Pase) activity in isolated liver microsomes in the absence of significant changed in enzyme expression. Incubation of Mg(2+)-deficient microsomes in the presence of 1mM external Mg(2+) returned G6Pase activity to levels measured in microsomes from animals on normal Mg(2+) diet. EDTA addition dynamically reversed the Mg(2+) effect. The effect of Mg(2+) or EDTA persisted in taurocholic acid permeabilized microsomes. An increase in G6Pase activity was also observed in liver microsomes from rats starved overnight, which presented a ~15% decrease in hepatic Mg(2+) content. In this model, G6Pase activity increased to a lesser extent than in Mg(2+)-deficient microsomes, but it could still be dynamically modulated by addition of Mg(2+) or EDTA. Our results indicate that (1) hepatic Mg(2+) content rapidly decreases following starvation or exposure to deficient diet, and (2) the loss of Mg(2+) stimulates G6P transport and hydrolysis as a possible compensatory mechanism to enhance intrahepatic glucose availability. The Mg(2+) effect appears to take place at the level of the substrate binding site of the G6Pase enzymatic complex or the surrounding phospholipid environment.
Copyright © 2011 Elsevier Inc. All rights reserved.
Figures


Similar articles
-
Acute effect of ethanol on hepatic reticular G6Pase and Ca2+ pool.Alcohol Clin Exp Res. 2013 Jan;37 Suppl 1(Suppl 1):E40-51. doi: 10.1111/j.1530-0277.2012.01933.x. Epub 2012 Sep 7. Alcohol Clin Exp Res. 2013. PMID: 22958133 Free PMC article.
-
Up-regulation of liver glucose-6-phosphatase in rats fed with a P(i)-deficient diet.Biochem J. 1999 Oct 15;343 Pt 2(Pt 2):393-6. doi: 10.1042/bj3430393. Biochem J. 1999. PMID: 10510305 Free PMC article.
-
Biphasic effect of extra-reticular Mg2+ on hepatic G6P transport and hydrolysis.Arch Biochem Biophys. 2007 Nov 15;467(2):283-90. doi: 10.1016/j.abb.2007.09.001. Epub 2007 Sep 15. Arch Biochem Biophys. 2007. PMID: 17931592 Free PMC article.
-
The glucose-6-phosphatase system.Biochem J. 2002 Mar 15;362(Pt 3):513-32. doi: 10.1042/0264-6021:3620513. Biochem J. 2002. PMID: 11879177 Free PMC article. Review.
-
Type I glycogen storage diseases: disorders of the glucose-6-phosphatase complex.Curr Mol Med. 2002 Mar;2(2):121-43. doi: 10.2174/1566524024605798. Curr Mol Med. 2002. PMID: 11949931 Review.
Cited by
-
Low Hepatic Mg2+ Content promotes Liver dysmetabolism: Implications for the Metabolic Syndrome.J Metab Syndr. 2014 Oct 1;3(4):165. doi: 10.4172/2167-0943.1000165. J Metab Syndr. 2014. PMID: 25905030 Free PMC article.
-
Reduced cellular Mg²⁺ content enhances hexose 6-phosphate dehydrogenase activity and expression in HepG2 and HL-60 cells.Arch Biochem Biophys. 2014 Apr 15;548:11-9. doi: 10.1016/j.abb.2014.02.016. Epub 2014 Mar 11. Arch Biochem Biophys. 2014. PMID: 24631573 Free PMC article.
-
Down-regulation of hepatic G-6-Pase expression in hyperglycemic rats: Intervention with biogenic gold nanoconjugate.Saudi J Biol Sci. 2020 Dec;27(12):3334-3341. doi: 10.1016/j.sjbs.2020.09.026. Epub 2020 Sep 22. Saudi J Biol Sci. 2020. PMID: 33304139 Free PMC article.
-
Acute effect of ethanol on hepatic reticular G6Pase and Ca2+ pool.Alcohol Clin Exp Res. 2013 Jan;37 Suppl 1(Suppl 1):E40-51. doi: 10.1111/j.1530-0277.2012.01933.x. Epub 2012 Sep 7. Alcohol Clin Exp Res. 2013. PMID: 22958133 Free PMC article.
-
Hepatic Response of Magnesium-Restricted Wild Type Mice.Metabolites. 2021 Nov 6;11(11):762. doi: 10.3390/metabo11110762. Metabolites. 2021. PMID: 34822420 Free PMC article.
References
-
- Romani A, Scarpa A. Front. Biosci. 2000;5:d720–d734. - PubMed
-
- Scarpa A, Brinley FJ. Fed. Proc. 1981;40:2646–2652. - PubMed
-
- Corkey BE, Duszynski J, Rich TL, Matschinsky B, Williamson JR. J. Biol. Chem. 1986;261:2567–2574. - PubMed
-
- Romani A, Scarpa A. Arch. Biochem. Biophys. 1992;298:1–12. - PubMed
-
- Maguire ME. Trends Pharmacol. Sci. 1984;5:73–77.
Publication types
MeSH terms
Substances
Grants and funding
LinkOut - more resources
Full Text Sources

