. 2011 Mar 17;9(3):243-251.
doi: 10.1016/j.chom.2011.02.003.

A major role for capsule-independent phagocytosis-inhibitory mechanisms in mammalian infection by Cryptococcus neoformans

Affiliations

A major role for capsule-independent phagocytosis-inhibitory mechanisms in mammalian infection by Cryptococcus neoformans

Cheryl D Chun et al. Cell Host Microbe. .

Abstract

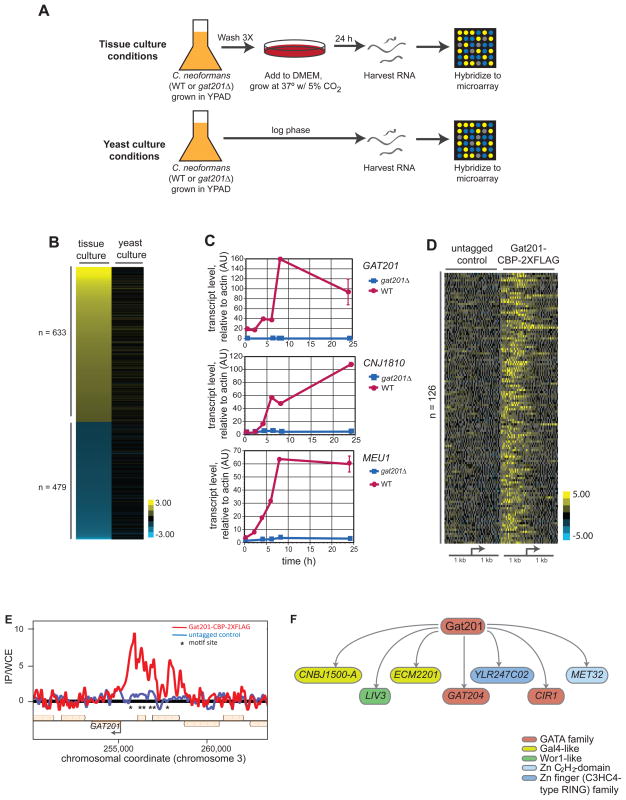
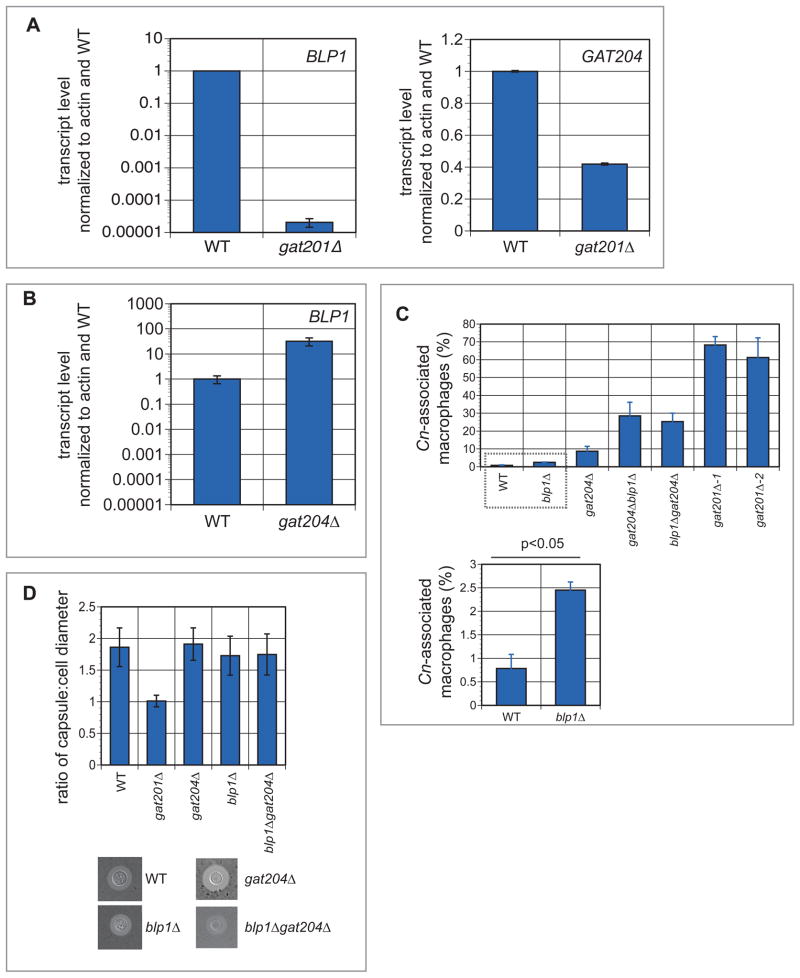
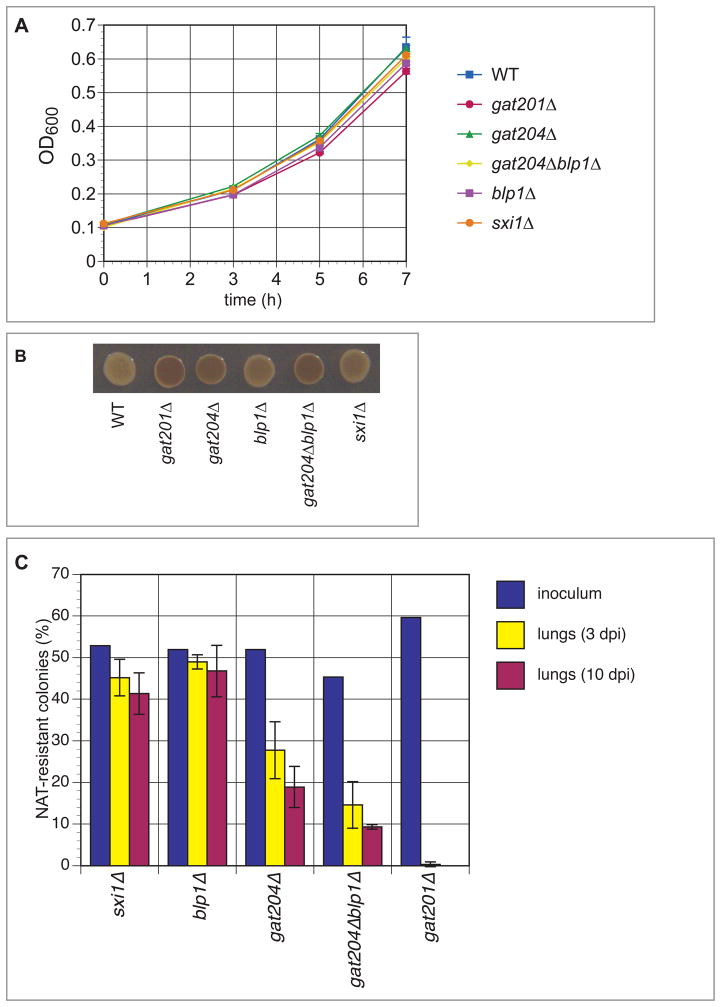
The antiphagocytic polysaccharide capsule of the human fungal pathogen Cryptococcus neoformans is a major virulence attribute. However, previous studies of the pleiotropic virulence determinant Gat201, a GATA family transcription factor, suggested that capsule-independent antiphagocytic mechanisms exist. We have determined that Gat201 controls the mRNA levels of ∼1100 genes (16% of the genome) and binds the upstream regions of ∼130 genes. Seven Gat201-bound genes encode for putative and known transcription factors--including two previously implicated in virulence--suggesting an extensive regulatory network. Systematic analysis pinpointed two critical Gat201-bound genes, GAT204 (a transcription factor) and BLP1, which account for much of the capsule-independent antiphagocytic function of Gat201. A strong correlation was observed between the quantitative effects of single and double mutants on phagocytosis in vitro and on host colonization in vivo. This genetic dissection provides evidence that capsule-independent antiphagocytic mechanisms are pivotal for successful mammalian infection by C. neoformans.


Figures

Figure 1
Figure 1. Identification of Gat201 transcriptional program and direct Gat201 targets
(A) Schematic of growth conditions used for transcriptional microarrays of yeast cells grown in tissue culture conditions (DMEM, 37°C, 5% CO2) or yeast culture conditions (YPAD, 30°C, atmospheric CO2). (B) Transcript profiling using custom whole-genome DNA microarrays was performed comparing gat201Δ versus wild type cells grown in tissue culture and in yeast culture conditions. Genes shown are those with both a minimum of a two-fold change and a statistically significant difference (using SAM analysis) between expression profiles in tissue culture and yeast media conditions. Values are plotted as the average ratio of transcript level in gat201Δ cells vs. wild type cells (log2) from four arrays per growth condition. (C) RT-qPCR analysis of the indicated transcripts following transfer from yeast culture conditions into tissue culture conditions. Samples were harvested at the indicated time points following transfer for RNA isolation and cDNA synthesis. Error bars at the 24 hour time point are the standard deviation of two samples. (D) Global summary of ChIP-chip results. Genes with enriched for Gat201-CBP-2XFLAG bound in their promoter regions were identified by comparing signals from replicate experiments performed with untagged and tagged strains. Genes are displayed which the largest difference between tagged and untagged genotypes in median value of the top five probe values among those within 1 kb of the predicted translational start site. Depicted are the ratios (log2) of immunoprecipitated DNA (IP) to whole cell extract (WSE) for each probe. (E) Example of ChIP-chip data. Ratios (log2) of IP DNA to WCE were plotted for each probe of the two tiling arrays at the chromosomal coordinates indicated. Asterisks indicated locations of motif in the chromosomal sequence shown. (F) Gat201 directly binds the regulatory regions of set of known and putative transcription factors. See also Figure S2.
Figure 2
Figure 2. In vitro analysis of Gat204 and Blp1
(A) Activation of BLP1 and GAT204 by Gat201. BLP1 (left panel) and GAT204 (right panel) transcript levels were assessed in wild type and gat201Δ cells grown in tissue culture conditions for 24 hours. Error bars are standard deviation (SD) of 2–4 samples. (B) Repression of BLP1 by Gat204. BLP1 transcript levels were assessed in wild type and gat204Δ cells grown in tissue culture conditions for 24 hours. Error bars are SD of two samples. (C) Quantification of phagocytosis defects. RAW264.7 macrophages were co-incubated with the designated C. neoformans strains for 24 hours then washed three times with PBS to remove unphagocytosed yeast. The macrophages were then counted to assay the number of macrophages with yeast associated. At least 200 macrophages were counted per well and each strain was assayed in triplicate. By Student’s t-test, the difference between blp1Δ and wild type association with macrophages was determined to be statistically significant. (D) Quantitative measurements of capsule size. Capsule was induced in the indicated strains by incubation in tissue culture conditions for 24 hours. Capsule and cell size were measured for at least 30 cells per strain, and the ratio of capsule to cell diameter calculated and averaged for each strain. Error bars denote SD. See also Figure S1.
Figure 3
Figure 3. Anti-phagocytosis mutants show reduced fitness during infection but normal rates in vitro
(A) Growth rate measurements. Log-phase wild type and mutant strains were grown for seven hours at 37°C in YPAD medium, and OD600 was measured every 2–3 hours. Error bars denote SD for cultures grown in triplicate. (B) Melanin assays. Melanin assay on L-DOPA plates demonstrates that none of the strains are hypomelanized. gat201Δ is hypermelanized, as previously noted in Liu et al (2008). gat204Δ is also hypermelanized, as is the gat204Δblp1Δ mutant. (C) Mouse infection data. Approximately 1:1 mixtures of H99 and the indicated mutant (marked with a nourseothricin [NAT] resistance gene) were inoculated intranasally into mice (A/J) (5 × 10⁵ total cells/mouse). The actual proportion of mutant cells in each inoculum were determined by plating a dilution of the inoculum on non-selective medium and then assaying 100–200 individual colonies for NAT resistance. At three and ten days post-infection, animals were sacrificed and the lungs, brains, and spleen from each were homogenized and serial dilutions were plated. 100–200 colonies per organ were assayed for NAT resistance to determine the percentage of mutant cells. Error bars represent the SD from three mice per inoculum. See also Figure S3.

Comment in

Similar articles

Cited by

References

    1. Blackstock R, Murphy JW. Secretion of the C3 component of complement by peritoneal cells cultured with encapsulated Cryptococcus neoformans. Infect Immun. 1997;65:4114–4121. - PMC - PubMed
    1. Botts MR, Hull CM. Dueling in the lung: how Cryptococcus spores race the host for survival. Curr Opin Microbiol. 2010;13:437–442. - PMC - PubMed
    1. Chow ED, Liu OW, O’Brien S, Madhani HD. Exploration of whole-genome responses of the human AIDS-associated yeast pathogen Cryptococcus neoformans var grubii: nitric oxide stress and body temperature. Curr Genet. 2007;52:137–148. - PubMed
    1. Chun CD, Liu OW, Madhani HD. A link between virulence and homeostatic responses to hypoxia during infection by the human fungal pathogen Cryptococcus neoformans. PLoS Pathog. 2007;3:e22. - PMC - PubMed
    1. Chun CD, Madhani HD. Ctr2 links copper homeostasis to polysaccharide capsule formation and phagocytosis inhibition in the human fungal pathogen Cryptococcus neoformans. PLoS One. 2010:5. - PMC - PubMed

Publication types

MeSH terms

Associated data