Review
. 2011 Apr 27;366(1568):1301-19.
doi: 10.1098/rstb.2010.0341.

The lens as a model for fibrotic disease

Affiliations
Review

The lens as a model for fibrotic disease

J A Eldred et al. Philos Trans R Soc Lond B Biol Sci. .

Abstract

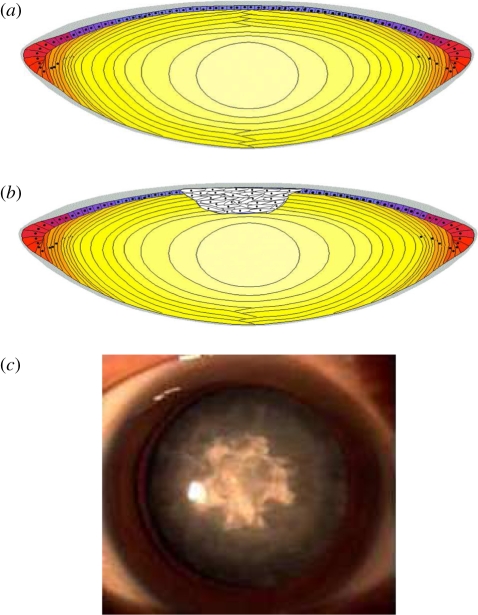
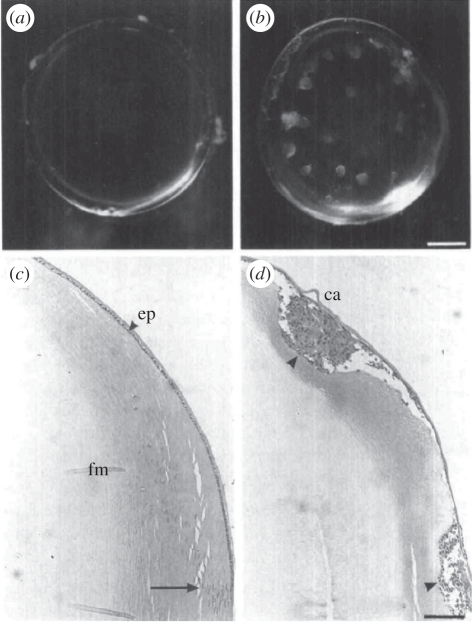
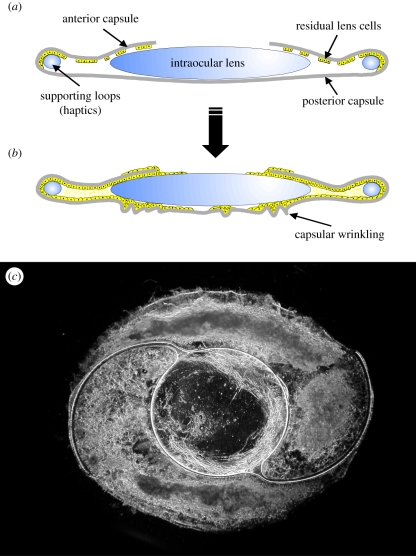
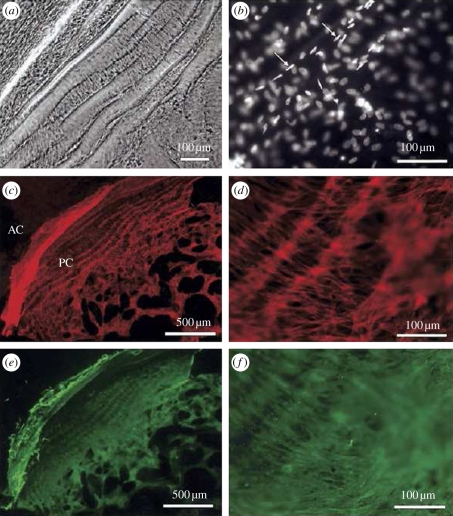
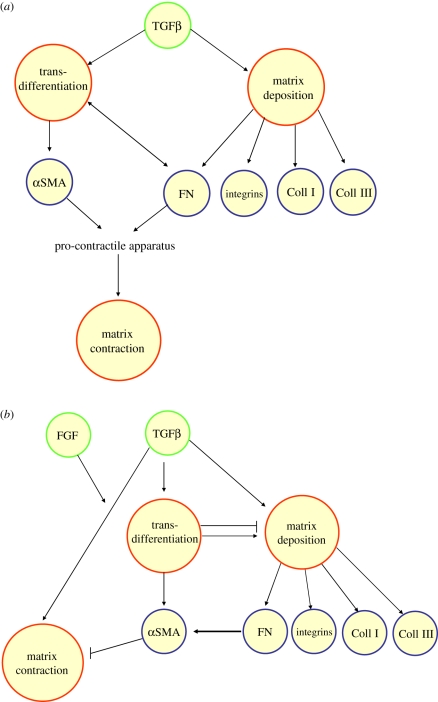
Fibrosis affects multiple organs and is associated with hyperproliferation, cell transdifferentiation, matrix modification and contraction. It is therefore essential to discover the key drivers of fibrotic events, which in turn will facilitate the development of appropriate therapeutic strategies. The lens is an elegant experimental model to study the processes that give rise to fibrosis. The molecular and cellular organization of the lens is well defined and consequently modifications associated with fibrosis can be clearly assessed. Moreover, the avascular and non-innervated properties of the lens allow effective in vitro studies to be employed that complement in vivo systems and relate to clinical data. Using the lens as a model for fibrosis has direct relevance to millions affected by lens disorders, but also serves as a valuable experimental tool to understand fibrosis per se.


Figures

Figure 1.
Figure 1.
(a) A schematic illustrating the cellular organization of the human lens. The site of anterior subcapsular cataract (ASC) is depicted in (b); ASC is associated with modification to the epithelium that is clinically seen as a fibrotic plaque (c; image kindly supplied by Dr Hong Zhang, Harbin Medical University, China). Grey area, capsule; purple area, epithelial cells; red area, germinative cells; orange area, elongating fibres; dark yellow area, cortical fibres and light yellow area, nucleus.
Figure 2.
Figure 2.
The effect of TGFβ on lens transparency and morphology. Whole lenses were cultured for 5 days (a,c) without TGFβ or (b,d) with TGFβ2. (a,b) Lenses were photographed through the posterior pole. (c,d) Sagittal sections were stained with haematoxylin and eosin; the equator of the lens is at the bottom edge of the micrograph in each case. In the presence of TGFβ, lenses developed anterior opacities (b) that corresponded with cellular plaques (d, arrowhead) underlying the lens capsule (ca). (a) Without TGFβ lenses remained clear and (c) retained normal histology with a monolayer of epithelial cells (ep) covered by the lens capsule overlying the fibre mass (fm). At the lens equator (arrow), cells began to elongate and to differentiate into fibres. Scale bars, (a,b) 400 µm; (c,d) 250 µm. Previously published in Hales et al. [28] with permission from the copyright holder, the Association for Research in Vision and Ophthalmology (ARVO).
Figure 3.
Figure 3.
Schematics of (a) the post-surgical capsular bag and (b) the extensive growth and modification that gives rise to posterior capsule opacification following cataract surgery. (c) A dark-field micrograph of a capsular bag removed from a donor eye that had undergone cataract surgery prior to death that exhibits light scattering regions beneath an intraocular lens. First published in Wormstone [29] with permission from Experimental Eye Research (Elsevier).
Figure 4.
Figure 4.
Examination of a capsular bag removed from a donor eye that had undergone cataract surgery 32 days before the time of death. (a) A phase-contrast micrograph shows wrinkling of the posterior capsule and the associated cellular morphology. (b) Fluorescence micrograph illustrating several layers of nuclei, some of which exhibit a spindle-shape (arrows) and are oriented along capsular wrinkles. (c) Fluorescence micrograph showing F-actin distribution in cells growing across the posterior capsule (PC) and also those growing on the outer surface of the anterior capsule (AC). (d) A higher-magnification fluorescent micrograph demonstrating the F-actin organization of cells residing on the posterior capsule in association with matrix contraction. (e) Fluorescence micrograph showing αSMA distribution in cells growing across the posterior capsule and also those growing on the outer surface of the anterior capsule. (f) A higher-magnification fluorescence micrograph demonstrating the αSMA organization of cells residing on the posterior capsule in association with matrix contraction. Previously published in Wormstone et al. [17] with permission from the copyright holder, the Association for Research in Vision and Ophthalmology (ARVO).
Figure 5.
Figure 5.
Replication of clinical features of lens fibrosis in a human in vitro tissue culture model for posterior capsule opacification. (a,b) Phase-contrast and (d,e) fluorescent micrographs demonstrate enhance matrix contraction and αSMA expression in response to TGFβ (10 ng ml−1) exposure (b,e). These images can be converted to a binary form that permits quantification (c,f), which greatly aids comparative assessment. Data were previously published by Wormstone et al. [33] with permission from Experimental Eye Research (Elsevier).
Figure 6.
Figure 6.
A gene expression profile of selected matrix components in the human lens cell line FHL 124. (a) The baseline signal of matrix component gene expression detected in non-stimulated serum-free controls using oligonucleotide microarrays. (b) Changes detected in gene expression of matrix components following 24 h culture in TGFβ (10 ng ml−1) conditions using oligonucleotide microarrays. The data are presented in a colorimetric form to indicate level detected (a) and fold change (b). A key for each is provided. Data previously published by Dawes et al. [30] with permission from Molecular Vision.
Figure 7.
Figure 7.
Validation of an in vitro method, the patch assay, to assess matrix contraction by human lens epithelial cells. The images clearly show the appearance of cell-free regions within the patch area after 3 days of exposure to 10 ng ml−1 TGFβ1 or -β2, which was determined by Coomassie blue staining. Moreover, these cell-free regions did not exhibit positive PAS staining or collagen, thus indicating matrix movement in association with cells. Data previously published by Dawes et al. [5] with permission from the copyright holder, the Association for Research in Vision and Ophthalmology (ARVO).
Figure 8.
Figure 8.
αSMA is not critical for TGFβ-induced matrix contraction: 24 h patch assay analysis. FHL 124 cells were seeded to form patches, then transfected with siRNA targeted to αSMA (thus reducing αSMA expression) or a scrambled (SCR) negative control and maintained in EMEM supplemented with 2%FCS. Patches were measured after 24 h of culture in control conditions or exposed to 10 ng ml−1 (a) TGFβ1 or (b) TGFβ2. Data represent the mean ± SEM (n = 4). *Significant difference between treated and untreated siαSMA (p ≤ 0.05, ANOVA with the Tukey test); πsignificant difference between siαSMA + TGFβ treated groups and siSCR + TGFβ-treated groups (p ≤ 0.05, ANOVA with the Tukey test). (c) Representative images of dishes for each experimental group ((a) open bar, −TGFβ1; filled black bar, +TGFβ1, (b) open bar, −TGFβ2; filled black bar, +TGFβ2). Data previously published by Dawes et al. [5] with permission from the copyright holder, the Association for Research in Vision and Ophthalmology (ARVO).
Figure 9.
Figure 9.
Putative pathways relating TGFβ to fibrotic events, (a) based on conventional dogma and (b) incorporating novel findings that challenge this view. Coll, collagen; FN, fibronectin.
Figure 10.
Figure 10.
Detection of MMP-2 and -9 in culture media of (a) in vitro capsular bags and (b) cultured ex vivo specimens, by gelatin zymography. Analysis of in vitro capsular bags was performed on the media of three cultures. Data are representative of the pattern observed in all cases in each group. In the case of cultured ex vivo specimens, the medium from one additional culture was analysed and showed a profile similar to the presented data. Data previously published by Wormstone et al. [17] with permission from the copyright holder, the Association for Research in Vision and Ophthalmology (ARVO).
Figure 11.
Figure 11.
A gene expression profile of integrins in FHL 124 cells. (a) The baseline signal of integrin gene expression detected in non-stimulated serum-free controls using oligonucleotide microarrays. (b) Changes detected in gene expression of integrins following 24 hr culture in TGFβ (10 ng ml−1) conditions using oligonucleotide microarrays. The data are presented in a colorimetric form to indicate (a) level detected and (b) fold change. Data previously published by Dawes et al. [30] with permission from Molecular Vision.

References

    1. Leask A., Abraham D. J. 2004. TGF-beta signaling and the fibrotic response. FASEB J. 18, 816–827 10.1096/fj.03-1273rev (doi:10.1096/fj.03-1273rev) - DOI - PubMed
    1. Radisky D. C., Przybylo J. A. 2008. Matrix metalloproteinase-induced fibrosis and malignancy in breast and lung. Proc. Am. Thorac. Soc. 5, 316–322 10.1513/pats.200711-166DR (doi:10.1513/pats.200711-166DR) - DOI - PubMed
    1. Laurent G. J., McAnulty R. J., Hill M., Chambers R. 2008. Escape from the matrix: multiple mechanisms for fibroblast activation in pulmonary fibrosis. Proc. Am. Thorac. Soc. 5, 311–315 10.1513/pats.200710-159DR (doi:10.1513/pats.200710-159DR) - DOI - PMC - PubMed
    1. McAnulty R. J. 2007. Fibroblasts and myofibroblasts: their source, function and role in disease. Int. J. Biochem. Cell Biol. 39, 666–671 10.1016/j.biocel.2006.11.005 (doi:10.1016/j.biocel.2006.11.005) - DOI - PubMed
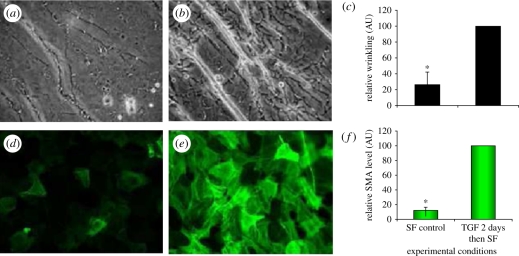
    1. Dawes L. J., Eldred J. A., Anderson I. K., Sleeman M., Reddan J. R., Duncan G., Wormstone I. M. 2008. TGF beta-induced contraction is not promoted by fibronectin–fibronectin receptor interaction, or alpha SMA expression. Invest. Ophthalmol. Vis. Sci. 49, 650–661 10.1167/iovs.07-0586 (doi:10.1167/iovs.07-0586) - DOI - PubMed

MeSH terms

Substances