. 2011 May 6;286(18):16186-96.
doi: 10.1074/jbc.M110.198952. Epub 2011 Mar 14.

Nonsteroidal anti-inflammatory drugs inhibit vascular smooth muscle cell proliferation by enabling the Ca2+-dependent inactivation of calcium release-activated calcium/orai channels normally prevented by mitochondria

Affiliations

Nonsteroidal anti-inflammatory drugs inhibit vascular smooth muscle cell proliferation by enabling the Ca2+-dependent inactivation of calcium release-activated calcium/orai channels normally prevented by mitochondria

Eva Muñoz et al. J Biol Chem. .

Abstract

Abnormal vascular smooth muscle cell (VSMC) proliferation contributes to occlusive and proliferative disorders of the vessel wall. Salicylate and other nonsteroidal anti-inflammatory drugs (NSAIDs) inhibit VSMC proliferation by an unknown mechanism unrelated to anti-inflammatory activity. In search for this mechanism, we have studied the effects of salicylate and other NSAIDs on subcellular Ca(2+) homeostasis and Ca(2+)-dependent cell proliferation in rat aortic A10 cells, a model of neointimal VSMCs. We found that A10 cells displayed both store-operated Ca(2+) entry (SOCE) and voltage-operated Ca(2+) entry (VOCE), the former being more important quantitatively than the latter. Inhibition of SOCE by specific Ca(2+) released-activated Ca(2+) (CRAC/Orai) channels antagonists prevented A10 cell proliferation. Salicylate and other NSAIDs, including ibuprofen, indomethacin, and sulindac, inhibited SOCE and thereby Ca(2+)-dependent, A10 cell proliferation. SOCE, but not VOCE, induced mitochondrial Ca(2+) uptake in A10 cells, and mitochondrial depolarization prevented SOCE, thus suggesting that mitochondrial Ca(2+) uptake controls SOCE (but not VOCE) in A10 cells. NSAIDs depolarized mitochondria and prevented mitochondrial Ca(2+) uptake, suggesting that they favor the Ca(2+)-dependent inactivation of CRAC/Orai channels. NSAIDs also inhibited SOCE in rat basophilic leukemia cells where mitochondrial control of CRAC/Orai is well established. NSAIDs accelerate slow inactivation of CRAC currents in rat basophilic leukemia cells under weak Ca(2+) buffering conditions but not in strong Ca(2+) buffer, thus excluding that NSAIDs inhibit SOCE directly. Taken together, our results indicate that NSAIDs inhibit VSMC proliferation by facilitating the Ca(2+)-dependent inactivation of CRAC/Orai channels which normally is prevented by mitochondria clearing of entering Ca(2+).


Figures
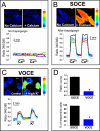
FIGURE 1.
FIGURE 1.
A10 cells show SOCE and VOCE. A10 cells were loaded with Fura-2/AM and subjected to fluorescence imaging of cytosolic Ca2+. A, in intact cells the addition of extracellular Ca2+ does not change the ratio of fluorescences excited at 340 and 380 nm (Ratio 340/380) reflecting [Ca2+]cyt. B, in thapsigargin-treated cells, readdition of Ca2+ increased this ratio in all cells (n = 5 experiments) reflecting SOCE. A further Ca2+ pulse evoked the same response. Pictures on top show representative ratio images (from 0 to 1) coded in pseudocolor. C, depolarization with medium containing a high concentration (75 mm) of K+ (in exchange for Na+) induced a lower increase in the ratio in a fraction of cells revealing VOCE (n = 3 experiments). D, top bars show the size of rise in ratio induced by SOCE and VOCE in responsive cells. Bottom bars show percent of cells showing SOCE and VOCE, respectively (mean ± S.E. (error bars), *, p < 0.05).
FIGURE 2.
FIGURE 2.
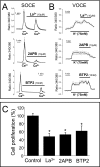
SOCE antagonists inhibit A10 cell proliferation. A, SOCE measurements were carried out as in Fig. 1. Panels show representative experiments for each antagonist tested. Average (mean ± S.E. (error bars)) recordings of all cells in the same fields (n = 7–9 cells) are shown (n = 3). B, effects of antagonists on VOCE were investigated as in Fig. 1. Antagonists were added at the indicated concentrations after depolarization (n = 3). C, A10 cells were cultured for 15 days in vitro, and the effects of antagonists on cell proliferation were tested. La3+ and 2-APB were used at 10 μm and BTP2 at 10 nm (*, p < 0.05 versus control, n = 3). Antagonists had no effect on cell viability (data not shown).
FIGURE 3.
FIGURE 3.
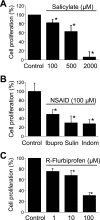
NSAIDs inhibit A10 cell proliferation. A, dose-dependent effects of salicylate (100–2000 μm) on A10 cell proliferation. B, effects of different NSAIDs including ibuprofen, sulindac, and indomethacin, all tested at 100 μm, on A10 cell proliferation. C, dose-dependent effects of (R)-flurbiprofen (1–100 μm) on A10 cell proliferation. *, p < 0.05 versus control (n = 3). Results are mean ± S.E. (error bars).
FIGURE 4.
FIGURE 4.
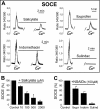
NSAIDs inhibit SOCE in A10 cells. SOCE was measured in A10 cells as in Fig. 1. A, Ca2+ recordings are mean ± S.E. (error bars; n = 9,9,18 cells, respectively) and representative of n = 3. B, bars show the dose-dependent effects of salicylate on SOCE (mean ± S.E. values, n = 3). C, bars show the effects of ibuprofen, indomethacin, and sulindac, all tested at 100 μm, on SOCE. *, p < 0.05.
FIGURE 5.
FIGURE 5.
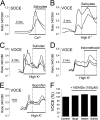
NSAIDs do not inhibit VOCE in A10 cells. SOCE was measured in A10 cells as in Fig. 1. Panels show Ca2+ recordings of individual cells in experiments representative of at least three similar ones. A, salicylate (500 μm) decreases [Ca2+]cyt after the Ca2+ readdition to thapsigargin-treated cells. B–F, effects of NSAIDs on VOCE were tested by recording the effect of NSAIDs perfused after depolarization with high K+ medium. Neither 500 μm salicylate (B), 100 μm sulindac (C), 100 μm indomethacin (D), nor 100 μm ibuprofen decreased [Ca2+]cyt when perfused during depolarization. F shows mean ± S.E. (error bars) values of the levels of [Ca2+]cyt before (control) and after NSAID treatment (p > 0.05, n = 3).
FIGURE 6.
FIGURE 6.
NSAIDs accelerate slow inactivation of CRAC currents in RBL cells under weak Ca2+ buffering conditions. A–C, average current-voltage (I/V) relationship of CRAC currents from RBL-2H3 cells patched with the strong buffer solution (10 mm BAPTA) at 2 (black trace), 100 (red trace), and 400 (blue trace) s after establishing the whole cell configuration and current kinetics in control cells (B, n = 16) and in cells exposed (C) to ibuprofen (n = 7), salicylate (n = 11), indomethacin (n = 6), all tested at 10–100 μm is shown. D, average CRAC currents were obtained from cells as shown in B and C, respectively. Currents sizes were extracted at −130 (black trace) and +80 (red trace) mV, normalized to the cell size, averaged, and plotted versus time. Currents were leak-corrected by subtracting averages of the currents from first three voltage ramps before CRAC channel activation. E, CRAC currents were studied in control cells with the weakly buffering solution (1.2 mm EGTA) and the mitochondrial mixture (see “Experimental Procedures”) except that cells were preincubated with CCCP for 5 min to disrupt mitochondrial Ca2+ uptake. F, same conditions were used as in E except that cells were preincubated with indomethacin (red trace), salicylate (black trace), or ibuprofen (blue trace). G, statistical analysis of CRAC currents was performed 6 min after establishing the whole cell configuration as a fraction of the maximal current for the control conditions and for experiments in the presence of R360 + RR. Levels of significance are indicated (**, p < 0.01; ***, p < 0.001). Errors bars indicate S.E.
FIGURE 7.
FIGURE 7.
SOCE, but not VOCE, induces mitochondrial Ca2+ uptake in A10 cells. A10 cells were transfected with GFP-aequorin targeted to mitochondria, loaded with coelenterazine, and subjected to bioluminescence imaging of mitochondrial [Ca2+] in single cells. Left (SOCE), A10 cells were treated with 1 μm thapsigargin for 10 min in Ca2+-free medium to deplete intracellular Ca2+ stores and perfused with extracellular Ca2+ containing medium to induce SOCE, and the effects on photonic emissions reflecting mitochondrial Ca2+ uptake were imaged. Pictures on top show a typical fluorescence image of transfected cells (left) and the accumulated photonic emissions during SOCE. Top traces show calculated [Ca2+]mit values in individual cells. Bottom traces reflect percent of remaining photonic emissions. Right (VOCE), cells were perfused with high K+-containing medium to induce VOCE, and the effects on photonic emissions reflecting mitochondrial Ca2+ uptake were imaged. Top pictures are representative fluorescence and bioluminescence images. Traces show [Ca2+]mit recordings in individual cells and percent remaining counts. Data are representative of at least three independent experiments of each kind. Pseudocolor scale goes from 0 to 10 photons/pixel.
FIGURE 8.
FIGURE 8.
Mitochondrial depolarization inhibits SOCE but not VOCE in A10 cells. SOCE was estimated in A10 cells as shown in Fig. 1. A, 10 μm FCCP (added in the presence of 0.12 μm oligomycin) inhibits SOCE in a reversible manner. B, mitochondrial depolarization with antimycin A (0.5 μg/ml) + oligomycin (0.12 μm) also inhibits SOCE in A10 cells. C, 10 μm FCCP added during SOCE decreases [Ca2+]cyt. D, FCCP added after depolarization with high K+ did not decrease [Ca2+]cyt but rather increased it. All data are single-cell recordings representative of 8–17 cells studied in at least three independent experiments for each panel.
FIGURE 9.
FIGURE 9.
NSAIDs depolarize mitochondria in A10 cells. The effects of NSAIDs on mitochondrial potential were tested by fluorescence microscopy of cells loaded with TMRM. A, effects of vehicle, salicylate (100–2000 μm), or FCCP (10 μm) on TMRM fluorescence were normalized to the value before addition of treatment and averaged (arrow). B, mean ± S.E. (error bars) values of three independent experiments are shown (*, p < 0.05). C, effects of vehicle (control), FCCP (10 μm), ibuprofen, indomethacin, and sulindac (all tested at 100 μm) on TMRM fluorescence were normalized to the value before addition of treatment (arrow). Results are representative of n = 3 experiments. D, effects of NSAIDs including salicylate, (R)-flurbiprofen, indomethacin, sulindac sulfide, and ibuprofen on ATP levels in A10 cell are shown. All NSAIDs were tested at 100 μm except salicylate which was tested at 500 μm. None of the treatments changed cell ATP levels in A10 cells (n = 3, p > 0.05).
FIGURE 10.
FIGURE 10.
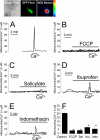
NSAIDs inhibit mitochondrial Ca2+ uptake in permeated A10 cells. A10 cells were transfected with GFP-aequorin targeted to mitochondria and subjected to bioluminescence counting imaging to estimate mitochondrial Ca2+ uptake in permeated, single cells. Pictures show a typical brightfield image, the GFP fluorescence image (GFP Fluor.), and photonic emissions released after a Ca2+ pulse (AEQ Biolum). Cells were permeated with low concentrations of digitonin in internal medium. A, perfusion with internal medium containing 10 μm Ca2+ induced a large rise in [Ca2+]mit. B, 10 μm FCCP abolished the rise in [Ca2+]mit induced by 10 μm Ca2+. C–E, salicylate (C, 500 μm), ibuprofen (D, 100 μm), and indomethacin (E, 100 μm) also inhibited [Ca2+]mit rises induced by 10 μm Ca2+. Traces are recordings representative of 4–7 cells studied in at least three independent experiments. F, bars show mean ± S.E. (error bars) values of [Ca2+]mit increases (n = 3; *, p < 0.05).

Similar articles

Cited by

References

    1. Beech D. J. (2007) Biochem. Soc. Trans. 35, 890–894 - PubMed
    1. House S. J., Potier M., Bisaillon J., Singer H. A., Trebak M. (2008) Pflugers Arch. 456, 769–785 - PMC - PubMed
    1. Khan Q., Mehta J. L. (2005) J. Atheroscler. Thromb. 12, 185–190 - PubMed
    1. Marra D. E., Simoncini T., Liao J. K. (2000) Circulation 102, 2124–2130 - PubMed
    1. Marra D. E., Liao J. K. (2001) Trends Cardiovasc. Med. 11, 339–344 - PubMed

Publication types

MeSH terms

LinkOut - more resources