. 2011 May;31(10):2134-50.
doi: 10.1128/MCB.05051-11. Epub 2011 Mar 14.

Motor protein Myo1c is a podocyte protein that facilitates the transport of slit diaphragm protein Neph1 to the podocyte membrane

Affiliations

Motor protein Myo1c is a podocyte protein that facilitates the transport of slit diaphragm protein Neph1 to the podocyte membrane

E Arif et al. Mol Cell Biol. 2011 May.

Abstract

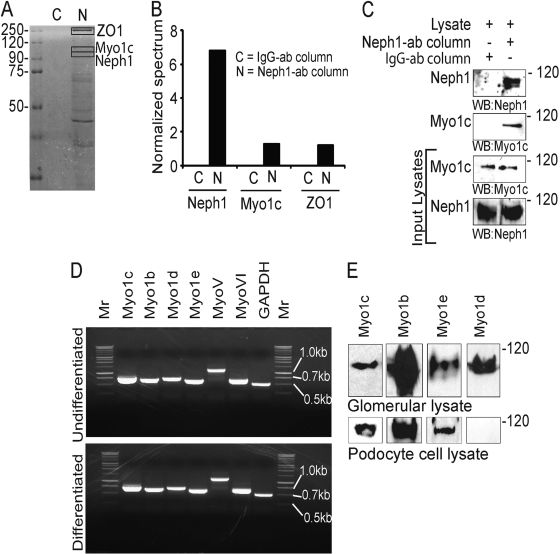
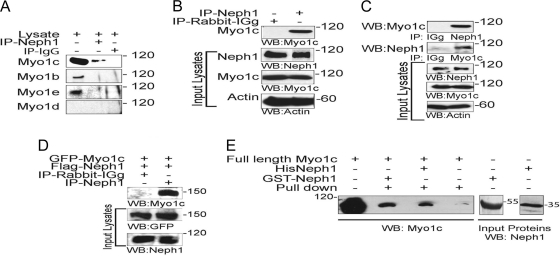
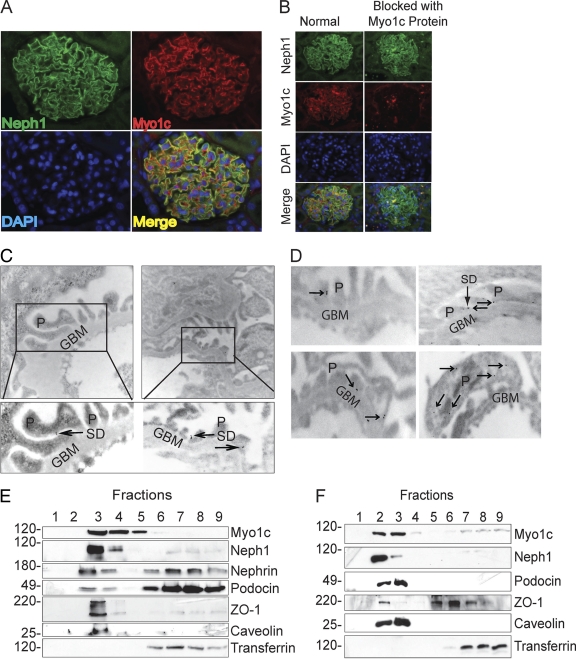
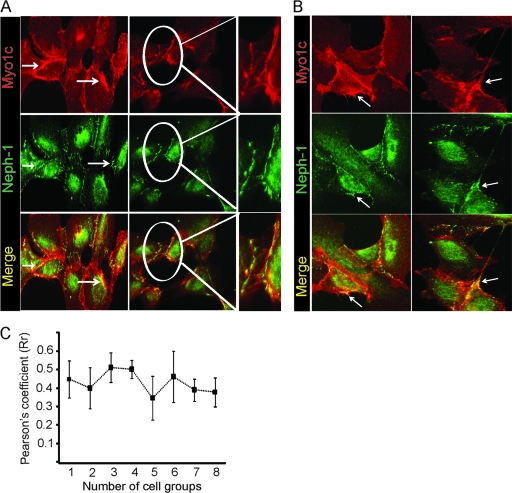
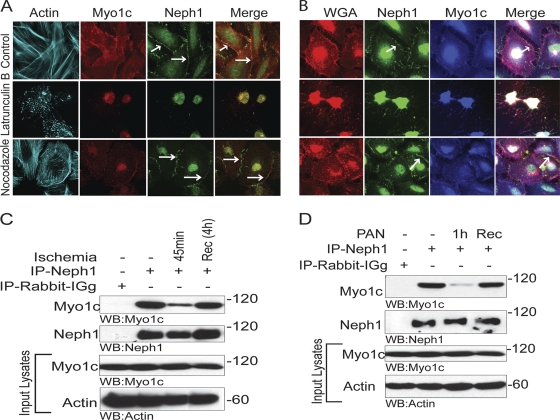
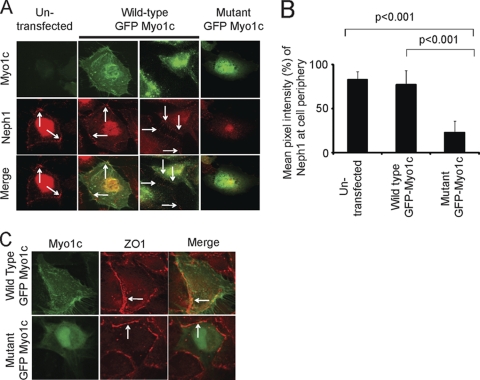
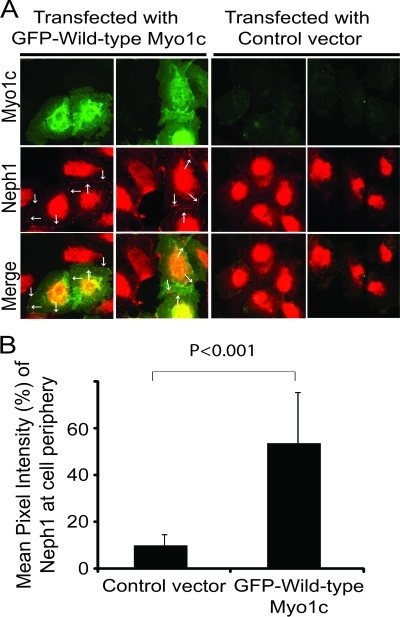
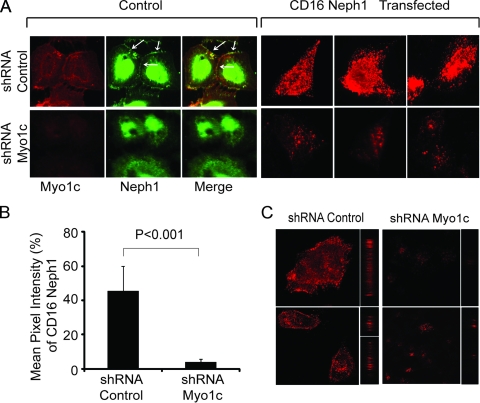
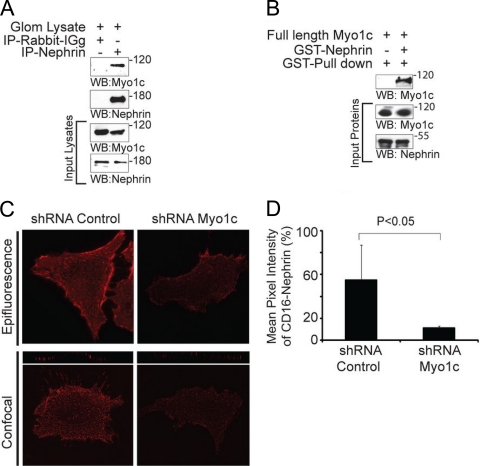
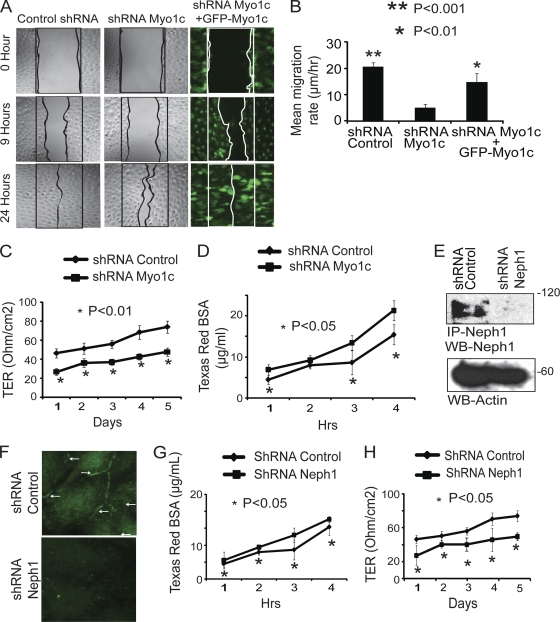
The podocyte proteins Neph1 and nephrin organize a signaling complex at the podocyte cell membrane that forms the structural framework for a functional glomerular filtration barrier. Mechanisms regulating the movement of these proteins to and from the membrane are currently unknown. This study identifies a novel interaction between Neph1 and the motor protein Myo1c, where Myo1c plays an active role in targeting Neph1 to the podocyte cell membrane. Using in vivo and in vitro experiments, we provide data supporting a direct interaction between Neph1 and Myo1c which is dynamic and actin dependent. Unlike wild-type Myo1c, the membrane localization of Neph1 was significantly reduced in podocytes expressing dominant negative Myo1c. In addition, Neph1 failed to localize at the podocyte cell membrane and cell junctions in Myo1c-depleted podocytes. We further demonstrate that similarly to Neph1, Myo1c also binds nephrin and reduces its localization at the podocyte cell membrane. A functional analysis of Myo1c knockdown cells showed defects in cell migration, as determined by a wound assay. In addition, the ability to form tight junctions was impaired in Myo1c knockdown cells, as determined by transepithelial electric resistance (TER) and bovine serum albumin (BSA) permeability assays. These results identify a novel Myo1c-dependent molecular mechanism that mediates the dynamic organization of Neph1 and nephrin at the slit diaphragm and is critical for podocyte function.


Figures

Fig. 1.
Fig. 1.
Identification of Myo1c as a Neph1 binding protein. (A) Eluates from Neph1 affinity and control columns were separated on SDS-PAGE gels and subjected to mass spectrometry. Protein bands containing ZO-1, Neph1, and Myo1c are highlighted. (B) Normalized spectrum values derived by using Scaffold software (Proteome Software, Inc., Portland, OR). (C) The same eluate was probed with Neph1 and Myo1c antibodies to confirm the results from the mass spectrometry analysis. Various myosin I proteins are expressed in human podocytes. (D) RT-PCR of differentiated and undifferentiated cultured human podocytes with the indicated primers detects various myosin family members. Mr, marker. (E) Cultured human podocytes and rat glomerular lysates were Western blotted (WB) with various class I myosin antibodies.
Fig. 2.
Fig. 2.
Neph1 interacts with Myo1c under in vivo and in vitro conditions. (A) Immunoprecipitation was performed with podocyte cell lysates using Neph1 antibody, and Western blotting was performed with antibodies specific to Myo1c, Myo1b, Myo1e, and Myo1d to determine their interactions with Neph1. (B) Neph1 was immunoprecipitated (IP) from rat glomerular lysates and immunoblotted with Myo1c antibody to confirm the interaction between Neph1 and Myo1c. (C) Reciprocal immunoprecipitation in cultured human podocytes using Myo1c antibody and Western blotting with Neph1 confirms the Neph1 and Myo1c interaction. (D) Plasmids encoding full-length GFP-Myo1c and Flag-Neph1 were transfected into COS-7 cells. Neph1 was immunoprecipitated from the cell lysate, and the immune complex was analyzed for Myo1c binding using Myo1c antibody. (E) The recombinant purified cytoplasmic domain of Neph1 as a GST or His fusion protein was mixed with purified full-length His-Myo1c expressed in baculovirus. Pulldown with either GST beads or Neph1 antibody and Western blotting with Myo1c antibody show binding between Neph1 and Myo1c.
Fig. 3.
Fig. 3.
Myo1c is a podocyte protein and colocalizes with Neph1. (A) Kidney sections from PFA-perfused rats were immunostained with Myo1c and Neph1 antibodies to determine the colocalization of Myo1c (red) with Neph1 (green) in glomeruli. (B) To determine the specificity of the Myo1c antibody, it was preincubated with the Myo1c protein prior to staining. Nuclear staining was performed with DAPI (blue). (C and D) Immunogold electron micrographs of kidney sections stained with Myo1c antibody show Myo1c localization adjacent to the slit diaphragm (arrows). P, podocytes; GBM, glomerular basement membrane; SD, slit diaphragm. (E and F) Lysate obtained from mouse glomeruli (E) or cultured human podocytes (F) was subjected to flotation gradient centrifugation using Optiprep. Fractions were analyzed by immunoblotting with the indicated antibodies. Western blotting with caveolin antibody identified the lipid raft fraction (fraction 3 at the interface between the 5 and 30% Optiprep densities).
Fig. 4.
Fig. 4.
Myo1c and Neph1 colocalize in cultured human podocytes. (A and B) Cultured podocytes grown on coverslips were fixed with 4% PFA and immunolabeled with Myo1c (red) and Neph1 (green) antibodies. As noted previously, Neph1 is concentrated at the cell membrane, while Myo1c is widely distributed in the cytoplasm and enriched at the cell membrane. The red-green overlay (yellow) shows Myo1c and Neph1 colocalization close to the cell membrane, in cell processes or lamellipodia, and also at cell-cell contacts in adjacent enlarged images. Representative images from five different experiments are shown, the junction region from one set of images is enlarged, and Neph1 and Myo1c colocalization is highlighted. (C) The Pearson's correlation coefficient (Rr) at the cell boundary of podocytes was calculated by using Image J software and shows a partial colocalization of Myo1c with Neph1, with an Rr of ∼0.4. Eight different cell groups (n = 8 cells) were included from five different experiments for quantitation.
Fig. 5.
Fig. 5.
The interaction of Neph1 and Myo1c is actin dependent. (A and B) Cultured podocytes grown on coverslips were treated with either latrunculin B (5 mM), nocodazole (30 μM), or growth medium for 1 h. Cells were then washed and processed for immunostaining with phalloidin (Alexa 488), Myo1c (Alexa 568/350), and Neph1 (Alexa 647/488) antibodies and with the membrane marker WGA (Alexa 594) (B). While latrunculin B induced the mislocalization of Myo1c and Neph1, treatment with nocodazole or normal medium had little effect. Renal injury induces the dissociation of the complex of Neph1 and Myo1c. (C) Male Sprague-Dawley rats were subjected to bilateral ischemia for 45 min with a reperfusion/recovery (Rec) time of 4 h. Isolated glomeruli were lysed in RIPA buffer. Neph1 was immunoprecipitated from glomerular lysates of control, ischemic, and recovered mice and Western blotted with Myo1c and Neph1 antibodies. (D) Podocyte cell lysates obtained from cells treated with PAN and from PAN treatment followed by recovery were subjected to Neph1 immunoprecipitation and Western blotted with Myo1c and Neph1 antibodies. Equivalent amounts of Neph1 and Myo1c were also examined, and actin was used as a loading control. These experiments were repeated three times, with identical results.
Fig. 6.
Fig. 6.
Neph1 localization at the podocyte cell membrane is altered in the presence of dominant negative Myo1c. (A and C) Human podocytes transfected with wt GFP-Myo1c or dominant mutant GFP-Myo1c (without ATP and actin binding domains) were analyzed by immunofluorescence with Neph1 (A) or ZO-1 (C) antibodies. Note the presence of Neph1 and ZO-1 at the cell membrane (arrows) in untransfected cells and cells transfected with wt Myo1c. In contrast, cells transfected with mutant GFP-Myo1c showed a significant reduction in the amount of Neph1 but not of ZO-1 at the cell membrane. (B) Quantitative analysis of transfected and untransfected cells was performed (n = 10 cells), and the bar diagram shows the mean pixel intensities of Neph1 at the cell periphery.
Fig. 7.
Fig. 7.
shRNA-mediated Myo1c knockdown inhibits Neph1 membrane localization. (A) Myo1c knockdown was induced by the transfection of a plasmid encoding Myo1c shRNA in cultured human podocytes. Stable transfectants were selected, and the extent of the Myo1c protein knockdown was assessed by Western blotting. (B) Control and knockdown cells were analyzed by immunofluorescence using Myo1c (Alexa 568) and Neph1 (Alexa 488) antibodies and phalloidin (Alexa 488). (C) Quantitation of Myo1c knockdown from five different experiments is represented as the mean pixel intensity of Myo1c. (D and E) Mean pixel intensity analysis of Myo1c and Neph1 at the podocyte cell membrane from five different experiments (15 cells each) was performed and shows a significant reduction in the amount of Neph1 at the cell membrane compared to control shRNA (P < 0.001). (F) Surface Neph1 was labeled in Myo1c knockdown and control cells with Neph1 extracellular antibody under unpermeabilized conditions. Immunofluorescence analysis was performed by using confocal imaging. (G) Quantitative analysis of single-plane images (n = 10 cells) shows a significant decrease in the mean pixel intensity of surface Neph1 labeling in Myo1c knockdown cells compared to control cells. (H) Immunofluorescence analysis of Myo1c knockdown cells with ZO-1 antibody shows that ZO-1 localization remains unchanged compared to control shRNA. (I) Lysates from control and Myo1c knockdown cells were Western blotted with Myo1c, Neph1, and Myo1e antibodies and show that Myo1c knockdown does not alter Neph1 and Myo1e protein levels. (J) Myo1c and control knockdown cells were fractionated to isolate the membrane fractions, which were analyzed by Western blotting using Neph1 antibody.
Fig. 8.
Fig. 8.
Transfection of mouse GFP-Myo1c rescues Neph1 membrane localization in Myo1c knockdown cells. (A) Myo1c knockdown cells were transfected with either mouse GFP–full-length Myo1c or a control vector and stained with Neph1 antibody (red). Neph1 localizes at the cell periphery only in GFP-Myo1c-transfected cells (arrows). (B) Quantitative analysis was performed on data from three independent experiments (n = 10 cells) to calculate the mean pixel intensity of Neph1 at the cell periphery in transfected cells.
Fig. 9.
Fig. 9.
Clustering of Neph1 at the podocyte membrane is inhibited in Myo1c-deleted cells. (A) A plasmid encoding the CD16-Neph1 cytoplasmic domain was transfected into Myo1c knockdown and control cells. (Right) Live cells were processed for clustering with CD16 antibody and analyzed by immunofluorescence. (Left) A parallel set of untransfected cells (control) was immunostained with Neph1 and Myo1c antibodies to determine the extent of the Myo1c knockdown. Representative images from three independent experiments are shown. (C) The same cells were also analyzed by confocal microscopy. (B) Quantitative analysis of transfected cells (n = 10 cells) shows a significant decrease in the mean pixel intensity of CD16-Neph1 in Myo1c knockdown cells compared to control cells.
Fig. 10.
Fig. 10.
Myo1c interacts with nephrin. (A) Nephrin was immunoprecipitated from glomerulus (Glom) lysates using nephrin antibody and Western blotted with Myo1c and nephrin antibodies to determine the interaction between nephrin and Myo1c. (B) A GST pulldown was performed with the cytoplasmic domain of nephrin expressed as a GST fusion protein mixed with baculovirus-expressed and purified full-length His-Myo1c, and Western blotting was performed with Myo1c antibody. (C) Myo1c knockdown and control cells were infected with retroviruses encoding CD16-nephrin. Live cells were processed for clustering with the CD16 antibody and analyzed by immunofluorescence. (D) Quantitative analysis of transfected cells (n = 10 cells) suggests a significant decrease in the mean pixel intensity of CD16-nephrin in Myo1c knockdown cells compared to control cells.
Fig. 11.
Fig. 11.
Depletion of Myo1c in podocytes results in decreased cell migration, reduced TER, and increased permeability for BSA. (A) A wound assay was performed with control cells, Myo1c knockdown podocytes, and Myo1c knockdown podocytes rescued with mouse GFP-Myo1c cDNA. Wound closure was observed at different time points (only data for 0 h, 9 h, and 24 h are presented). Unlike Myo1c knockdown cells, control and rescued cells showed complete wound closure in 24 h. (B) Quantitative analysis shows a significant reduction in the mean rate of migration of knockdown cells compared to control cells (P < 0.001) and rescued cells (P < 0.01). (C) Myo1c knockdown and control podocyte cells were grown on Transwell filters, and electrical resistance was measured. Myo1c knockdown cells showed reduced TER compared to that of controls (P < 0.05). (D) Control and Myo1c knockdown cells grown on Transwell filters were subjected to a paracellular albumin flux assay using Texas Red-labeled albumin. Increased albumin flux over time was observed for Myo1c knockdown podocytes compared to control cells (P < 0.05). (E and F) A plasmid encoding Neph1 shRNA was used to generate stable Neph1 knockdown cells, and the knockdown was assessed by immunoprecipitation and Western blotting (E) and immunostaining (F). (G and H) Similarly to Myo1c knockdown cells, albumin flux and TER analyses of Neph1 knockdown cells showed increases in albumin influx (G) and reductions in the TER (H) in Neph1 knockdown cells compared to controls (P < 0.05).

References

    1. Bahler M., Rhoads A. 2002. Calmodulin signaling via the IQ motif. FEBS Lett. 513:107–113 - PubMed
    1. Barletta G. M., Kovari I. A., Verma R. K., Kerjaschki D., Holzman L. B. 2003. Nephrin and Neph1 co-localize at the podocyte foot process intercellular junction and form cis hetero-oligomers. J. Biol. Chem. 278:19266–19271 - PubMed
    1. Barylko B., Jung G., Albanesi J. P. 2005. Structure, function, and regulation of myosin 1C. Acta Biochim. Pol. 52:373–380 - PubMed
    1. Benzing T. 2004. Signaling at the slit diaphragm. J. Am. Soc. Nephrol. 15:1382–1391 - PubMed
    1. Bose A., et al. 2002. Glucose transporter recycling in response to insulin is facilitated by myosin Myo1c. Nature 420:821–824 - PubMed

Publication types

MeSH terms

LinkOut - more resources