. 2011 Mar 21;192(6):949-57.
doi: 10.1083/jcb.201009028. Epub 2011 Mar 14.

Metabolic status rather than cell cycle signals control quiescence entry and exit

Affiliations

Metabolic status rather than cell cycle signals control quiescence entry and exit

Damien Laporte et al. J Cell Biol. .

Abstract

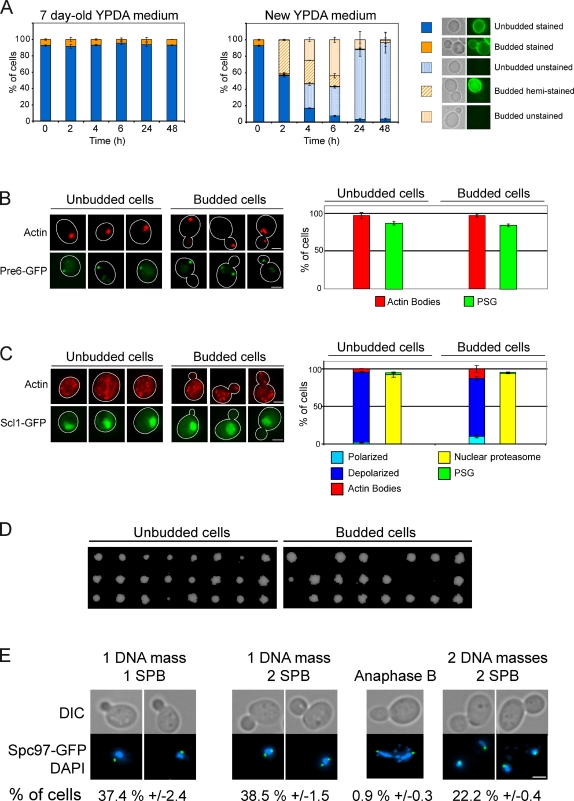
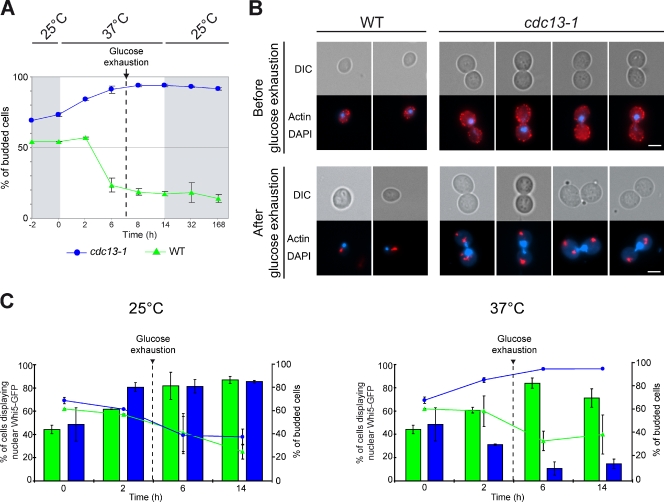
Quiescence is defined as a temporary arrest of proliferation, yet it likely encompasses various cellular situations. Our knowledge about this widespread cellular state remains limited. In particular, little is known about the molecular determinants that orchestrate quiescence establishment and exit. Here we show that upon carbon source exhaustion, budding yeast can enter quiescence from all cell cycle phases. Moreover, using cellular structures that are candidate markers for quiescence, we found that the first steps of quiescence exit can be triggered independently of cell growth and proliferation by the sole addition of glucose in both Saccharomyces cerevisiae and Schizosaccharomyces pombe. Importantly, glucose needs to be internalized and catabolized all the way down to glycolysis to mobilize quiescent cell specific structures, but, strikingly, ATP replenishment is apparently not the key signal. Altogether, these findings strongly suggest that quiescence entry and exit primarily rely on cellular metabolic status and can be uncoupled from the cell cycle.


Figures

Figure 1.
Figure 1.
A yeast stationary phase population contains quiescent cells arrested in all cell cycle stages. (A) No cell growth or division could be observed after 7 d in YPDA. A 7-d-old culture of WT prototroph strain was stained with ConA-FITC, then washed and transferred back into either old or new YPDA medium. Stained, unstained, or hemi-stained cells were counted. (B and C) Actin cytoskeleton organization revealed by phalloidin staining and proteasome localization in WT cells grown for 7 d in YPDA (B) and 30 min after refeeding with YPDA (C). The proteasome localization was followed using Pre6p-GFP (B) or Scl1p-GFP (C). Cell outlines are drawn in white. (D) Colony formation after microseparation of unbudded and budded cells grown for 7 d in YPDA. (E) Budded quiescent cells can be arrested in all cell cycle stages. WT cells expressing Spc97p, a spindle pole body component, fused to GFP were grown for 7 d in YPDA and stained with DAPI (numbers are percentages of budded cells). For each time point, n > 200 cells, two experiments. Errors bars indicate SEM. Bars, 2 µm.
Figure 2.
Figure 2.
Cells can enter quiescence in G2/M upon glucose exhaustion. (A) Diagram representing the experimental protocol: WT and cdc13-1 rho0 cells were grown in YPDA at 25°C. At OD600nm 2, cells were transferred to 37°C for 14 h, then transferred back to 25°C. Budding indexes for WT and cdc13-1 rho0 strains are shown. (B) Actin cytoskeleton organization in WT and cdc13-1 rho0 before and after glucose exhaustion, respectively, 6 and 32 h after the shift to 37°C. Bars, 2 µm. (C) Whi5p-GFP localization in WT (green) and cdc13-1 rho0 cells (blue). WT and cdc13-1 rho0 Whi5p-GFP–expressing cells were grown in YPDA at 25°C. At OD600nm 2, cells were transferred to 37°C or to 25°C for 14 h. The budding index is indicated for each time point (WT, green triangles; cdc13-1 rho0, blue circles). Glucose exhaustion is indicated. n > 200 cells for each time point, two experiments. Errors bars indicate SEM.
Figure 3.
Figure 3.
Quiescence exit can be triggered independently of reentry into the proliferation cycle. (A) WT cells were grown for 7 d in YPDA then transferred into the indicated medium. The budding index and the actin cytoskeleton organization are shown. (B) WT cells expressing Pre4p, a proteasome subunit, fused to GFP, were grown for 7 d in YPDA then transferred into the indicated medium. For each time point, the budding index and proteasome localization were monitored. (C) S. pombe expressing Pad1-GFP, a proteasome subunit, fused to GFP, were grown for 4 d and then transferred into the indicated medium. For each time point, proteasome localization was monitored. Cell outlines are drawn in white. n > 200 cells, two experiments. Errors bars indicate SEM. Bars, 2 µm.
Figure 4.
Figure 4.
Actin body mobilization requires glucose catabolism. (A) Schematic representation of the glycolysis pathway. Genes encoding each activity in S. cerevisiae are indicated in green. G6P, glucose-6-phosphate; F6P, fructose-6-phosphate; F1,6BP, fructose 1,6 bisphosphate; DHAP, dihydroxy acetone phosphate; G3P, glyceraldehyde 3 phosphate; 1,3BPG, 1,3 bis phosphoglycerate; 3-PG, 3 phosphoglycerate; 2-PG, 2 phosphoglycerate; PEP, phosphoenolpyruvate. (B) WT, snf3Δ, rgt2Δ, gpr1Δ (Δsensors) and hxk1Δ, hxk2Δ, and glk1Δ (Δhexokinases) strains were grown in galactose-rich medium. WT and a strain that cannot uptake glucose (Δtransporters strain; Wieczorke et al., 1999) were grown in maltose-rich medium. WT and pgi1Δ mutant were grown in fructose-rich medium. WT, pfk1Δ, pfk2Δ double mutant, and pgk1Δ mutants were grown in lactate-rich medium. After 7 d, cells were transferred into glucose (2%) and the actin cytoskeleton remodeling was monitored by phalloidin staining. (C) UV chromatograms from WT cells grown for 7 d in YPDA (black line), then transferred for 15 min into 2% glucose (red line) or into water (green line). Blue insets show enlarged views of the of AICAR and SAICAR peaks, the black inset shows amperometric detection of G6P and F1,6BP. (D and E) WT and pgi1 strains were grown for 7 d in rich medium containing 2% fructose, then transferred into either a 2% glucose or fructose solution. (D) ATP, G6P, and F1,6BP concentration measured before (7 d) and 15 min after transfer. (E) Actin cytoskeleton organization revealed by phalloidin staining. For each time point, n > 200 cells, at least two experiments. Error bars indicate SEM.

References

    1. Allen C., Büttner S., Aragon A.D., Thomas J.A., Meirelles O., Jaetao J.E., Benn D., Ruby S.W., Veenhuis M., Madeo F., Werner-Washburne M. 2006. Isolation of quiescent and nonquiescent cells from yeast stationary-phase cultures. J. Cell Biol. 174:89–100 10.1083/jcb.200604072 - DOI - PMC - PubMed
    1. Aragon A.D., Rodriguez A.L., Meirelles O., Roy S., Davidson G.S., Tapia P.H., Allen C., Joe R., Benn D., Werner-Washburne M. 2008. Characterization of differentiated quiescent and nonquiescent cells in yeast stationary-phase cultures. Mol. Biol. Cell. 19:1271–1280 10.1091/mbc.E07-07-0666 - DOI - PMC - PubMed
    1. Burke D.J., Church D. 1991. Protein synthesis requirements for nuclear division, cytokinesis, and cell separation in Saccharomyces cerevisiae. Mol. Cell. Biol. 11:3691–3698 - PMC - PubMed
    1. Coller H.A., Sang L., Roberts J.M. 2006. A new description of cellular quiescence. PLoS Biol. 4:e83 10.1371/journal.pbio.0040083 - DOI - PMC - PubMed
    1. Cooper S. 2003. Reappraisal of serum starvation, the restriction point, G0, and G1 phase arrest points. FASEB J. 17:333–340 10.1096/fj.02-0352rev - DOI - PubMed

Publication types

MeSH terms