. 2011 Mar 21;192(6):1057-72.
doi: 10.1083/jcb.201008012. Epub 2011 Mar 14.

Control of bone formation by the serpentine receptor Frizzled-9

Affiliations

Control of bone formation by the serpentine receptor Frizzled-9

Joachim Albers et al. J Cell Biol. .

Abstract

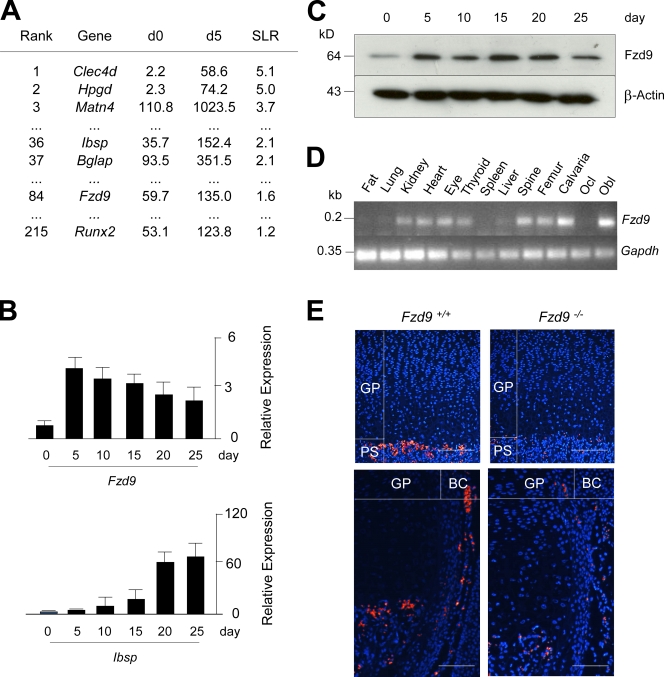
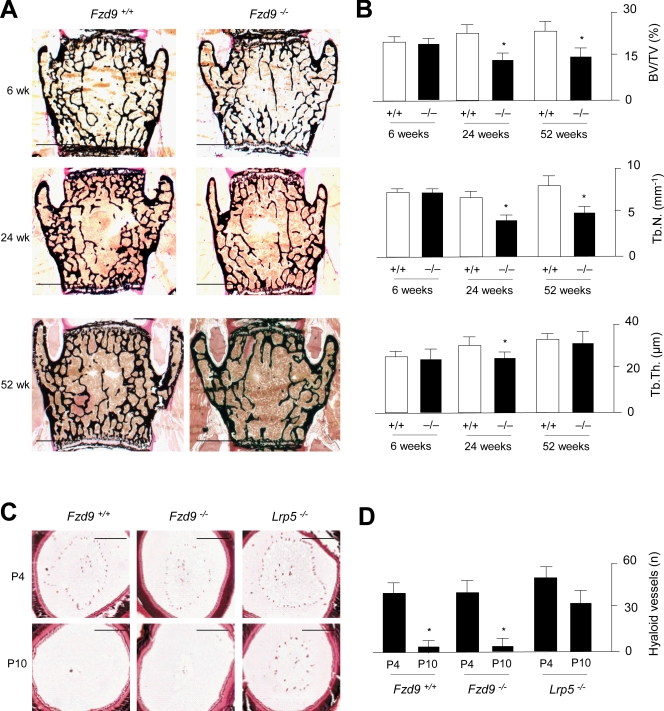
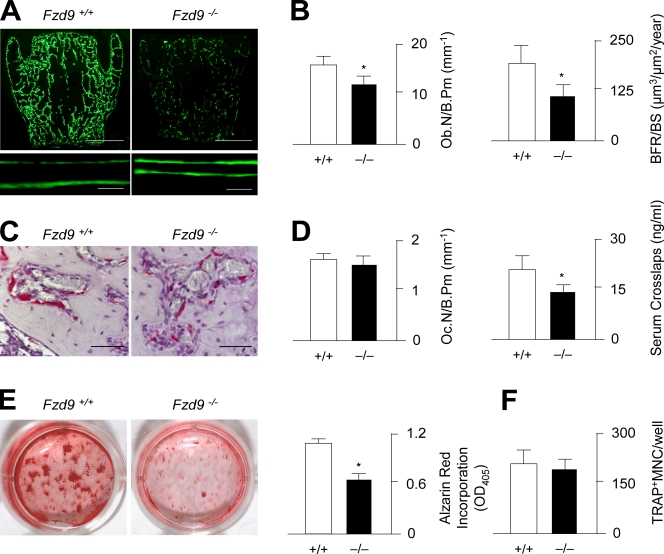
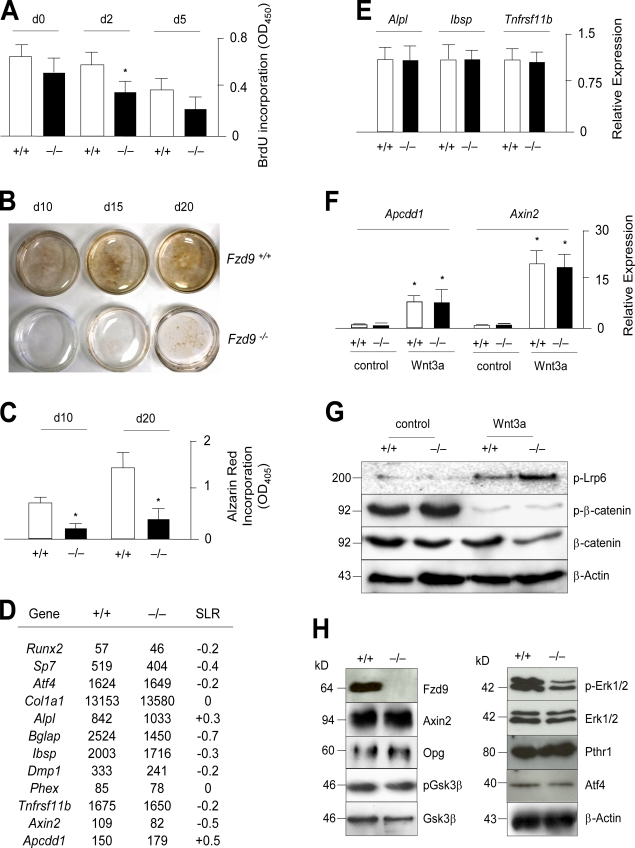
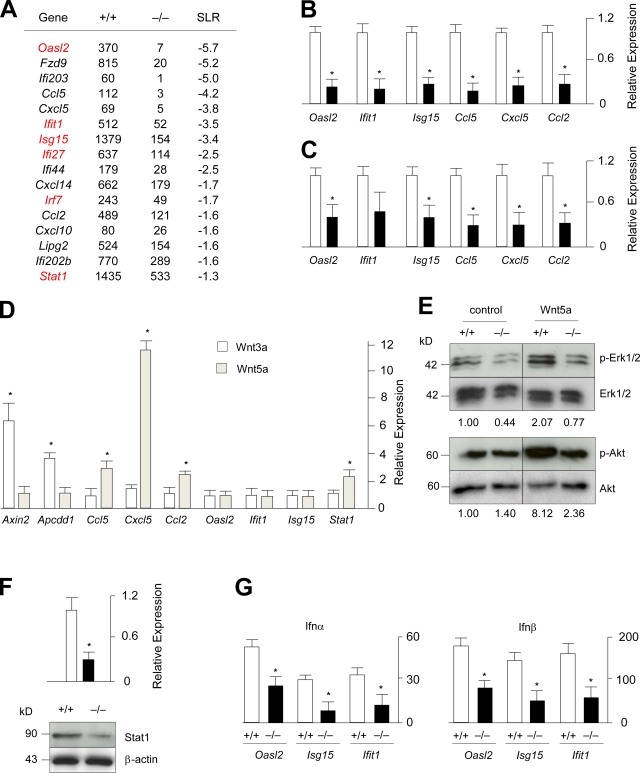
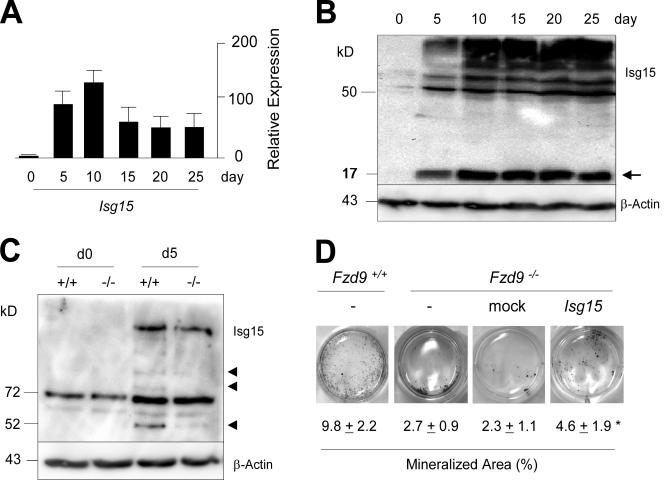
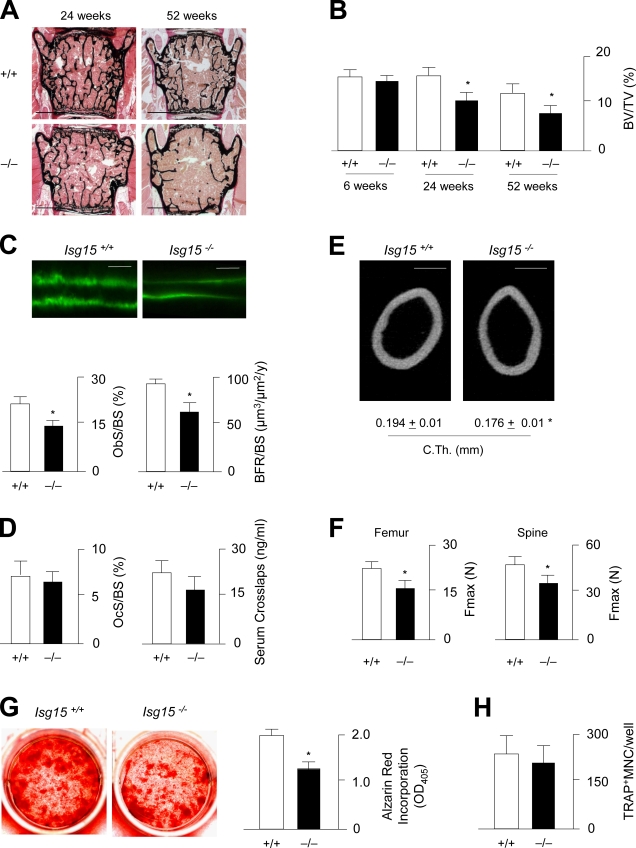
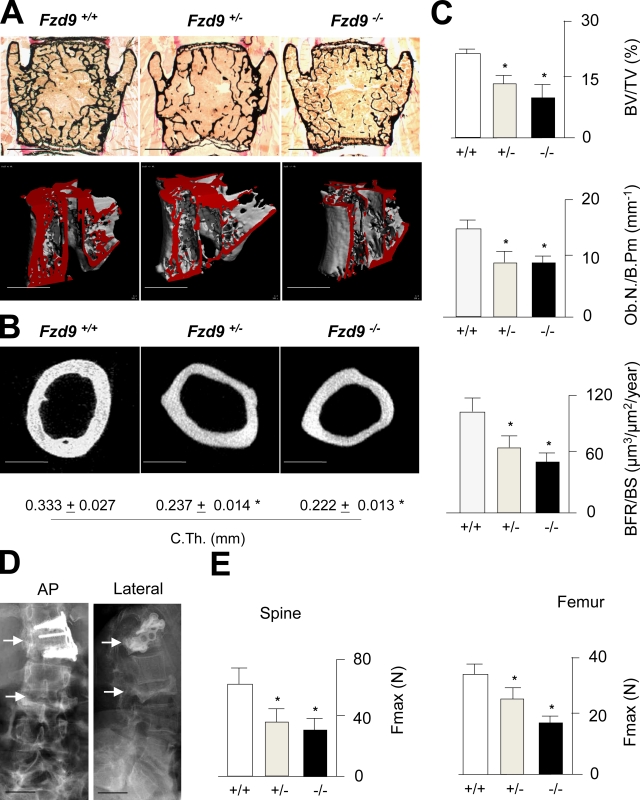
Although Wnt signaling in osteoblasts is of critical importance for the regulation of bone remodeling, it is not yet known which specific Wnt receptors of the Frizzled family are functionally relevant in this process. In this paper, we show that Fzd9 is induced upon osteoblast differentiation and that Fzd9(-/-) mice display low bone mass caused by impaired bone formation. Our analysis of Fzd9(-/-) primary osteoblasts demonstrated defects in matrix mineralization in spite of normal expression of established differentiation markers. In contrast, we observed a reduced expression of chemokines and interferon-regulated genes in Fzd9(-/-) osteoblasts. We also identified the ubiquitin-like modifier Isg15 as one potential downstream mediator of Fzd9 in these cells. Importantly, our molecular analysis further revealed that canonical Wnt signaling is not impaired in the absence of Fzd9, thus explaining the absence of a bone resorption phenotype. Collectively, our results reveal a previously unknown function of Fzd9 in osteoblasts, a finding that may have therapeutic implications for bone loss disorders.


Figures

Figure 1.
Figure 1.
Expression of Fzd9 in osteoblasts. (A) Ranking of the genes with the strongest induction of expression between day 0 (d0) and day 5 (d5) of primary osteoblast differentiation. Given are the signal intensities (Affymetrix) for both time points and the signal log ratios (SLR). (B) qRT-PCR for Fzd9 and Ibsp expression between day 0 and day 25 of primary osteoblast differentiation. Error bars represent means ± SD (n = 3). (C) Western blot confirming the presence of Fzd9 in primary osteoblasts. (D) RT-PCR analysis of Fzd9 expression in various tissues and primary bone cells (Ocl, osteoclast; Obl, osteoblast). (E) In situ hybridization in tibia sections from 3-d-old wild-type (Fzd9+/+) and Fzd9-deficient (Fzd9−/−) mice showing Fzd9 expression in the primary spongiosa (PS) and the bone collar (BC) region but not in the growth plate (GP). Bars, 200 µm. Black lines indicate that intervening lanes have been spliced out.
Figure 2.
Figure 2.
Osteopenia in Fzd9-deficient mice. (A) von Kossa/van Gieson staining of nondecalcified sections from vertebral bodies of wild-type and Fzd9−/− mice at the indicated ages. Bars, 1 mm. (B) Histomorphometric quantification of the trabecular bone volume per tissue volume (BV/TV), the trabecular number (Tb.N.), and the trabecular thickness (Tb.Th.) in wild-type (white bars) and Fzd9−/− (black bars) mice. (C) Hematoxylin/eosin staining of eyeballs from 4-d-old (P4) and 10-d-old (P10) wild-type, Fzd9−/−, and Lrp5−/− mice. Bars, 250 µm. (D) Quantification of hyaloid vessels. All error bars represent means ± SD (n = 6). Asterisks indicate statistically significant differences (P < 0.05).
Figure 3.
Figure 3.
Decreased bone formation rate in Fzd9-deficient mice. (A) Fluorescent micrographs of vertebral body sections from 24-wk-old wild-type and Fzd9−/− mice reveal a reduced number of calcein-labeled surfaces and a smaller distance between labeling fronts in the latter ones. Bars: (top) 1 mm; (bottom) 20 µm. (B) Histomorphometric quantification of the osteoblast number per bone perimeter (Ob.N/B.Pm) and the bone formation rate per bone surface (BFR/BS). (C) TRAP activity staining of osteoclasts reveals no difference between 24-wk-old wild-type and Fzd9-deficient littermates. Bars, 50 µm. (D) Histomorphometric quantification of the osteoclast number per bone perimeter and concentrations of collagen degradation products (CrossLaps) in the serum. (B and D) n = 6. (E) Alizarin red staining of bone marrow cells differentiated into osteoblasts for 10 d and quantification of the mineralized area. (F) Quantification of the number of TRAP-positive multinucleated (MNC) osteoclasts differentiated from bone marrow precursor cells of wild-type and Fzd9−/− mice. (E and F) n = 3. Error bars represent means ± SD. Asterisks indicate statistically significant differences (P < 0.05).
Figure 4.
Figure 4.
Cell-autonomous defect of Fzd9-deficient osteoblasts. (A) BrdU incorporation assay using wild-type and Fzd9−/− primary osteoblasts. n = 8. (B) von Kossa staining of the mineralized matrix reveals a cell-autonomous defect of bone formation in Fzd9−/− osteoblasts. (C) Quantification of the alizarin red incorporation in wild-type and Fzd9−/− primary osteoblasts at the indicated stages of differentiation. (D) Normal expression of known osteoblast differentiation markers and Wnt target genes in Fzd9−/− osteoblasts. Given are the signal intensities (Affymetrix) for wild-type and Fzd9−/− osteoblasts at day 10 (d10) of differentiation and the signal log ratios (SLR). (E) qRT-PCR expression analysis for the indicated genes in wild-type and Fzd9−/− osteoblasts. (F) qRT-PCR expression analysis for the indicated genes in wild-type and Fzd9−/− osteoblasts after a 6-h stimulation by Wnt3a. (C, E, and F) n = 3. (G) Western blotting with the indicated antibodies demonstrates that canonical Wnt signaling is unaffected in Fzd9−/− osteoblasts. Molecular mass markers represent kilodaltons. (H) Western blotting with the indicated antibodies demonstrates decreased Erk1/2 phosphorylation in Fzd9−/− osteoblasts. Error bars represent means ± SD. Asterisks indicate statistically significant differences (P < 0.05). Black lines indicate that intervening lanes have been spliced out.
Figure 5.
Figure 5.
Decreased expression of chemokines and interferon-regulated genes in Fzd9−/− osteoblasts. (A) Signal intensities (Affymetrix) and signal log ratios for wild-type and Fzd9−/− osteoblasts at day 10 of differentiation. Besides Fzd9 itself, genes either encode chemokines (Cclx and Cxclx) or have been identified as interferon regulated (Oasl2, Ifix, Isg15, Ligp2, and Irfx). Genes highlighted in red displayed a signal log ratio (SLR) >2.0 in the initial GeneChip experiment shown in Fig. 1 A. (B) qRT-PCR expression analysis for the indicated genes in wild-type and Fzd9−/− osteoblasts. (C) qRT-PCR expression analysis for the indicated genes in wild-type and Fzd9−/− femora. (D) qRT-PCR expression analysis for the indicated genes in wild-type osteoblasts treated for 6 h with Wnt3a or Wnt5a. (E) Western blotting with the indicated antibodies demonstrates decreased Erk1/2 and Akt phosphorylation in Fzd9−/− osteoblasts. The relative changes of the ratios between the phosphorylated and nonphosphorylated forms are given on the bottom. (F) qRT-PCR expression analysis and Western blotting demonstrate decreased Stat1 expression in Fzd9−/− osteoblasts. (G) qRT-PCR expression analysis for the indicated genes in wild-type and Fzd9−/− osteoblasts after a 6-h stimulation by Ifn-α or Ifn-β. Error bars represent means ± SD (n = 3). Asterisks represent statistically significant differences (P < 0.05). Black lines indicate that intervening lanes have been spliced out.
Figure 6.
Figure 6.
Protein ISGylation in osteoblasts. (A) qRT-PCR expression analysis for Isg15 at different stages of primary osteoblast differentiation. Error bars represent means ± SD (n = 3). (B) Western blotting with an Isg15-specific antibody demonstrating an increase of free Isg15 (arrow) and ISGylated proteins during differentiation of wild-type osteoblasts. (C) Decreased ISGylation of specific proteins (arrowheads) in Fzd9−/− osteoblasts at day 5 (d5) of differentiation. (D) von Kossa staining of mineralized matrix in wild-type and Fzd9−/− osteoblasts at day 10 of differentiation. Fzd9−/− cultures were either transduced with an empty (mock) or an Isg15-encoding retroviral vector as indicated. Quantification of the mineralized area is given on the bottom. Values represent means ± SD (n = 3). The asterisk represents a statistically significant difference to untreated cells (P < 0.05). Black lines indicate that intervening lanes have been spliced out.
Figure 7.
Figure 7.
Decreased bone formation in Isg15-deficient mice. (A) von Kossa/van Gieson staining of nondecalcified sections of vertebral bodies from 24- and 52-wk-old wild-type and Isg15−/− mice. Bars, 1 mm. (B) Histomorphometric quantification of the trabecular bone volume at the indicated ages. BV/TV, bone volume per tissue volume. (C) Fluorescent micrographs reveal a reduced distance between the calcein-labeling fronts in 24-wk-old Isg15−/− mice. Bars, 20 µm. The histomorphometric quantification of the osteoblast surface per bone surface (ObS/BS) and the bone formation rate is given on the bottom. (D) Histomorphometric quantification of the osteoclast surface per bone surface and concentrations of collagen degradation products in the serum. (E) Cross-sectional µCT scanning of the femora from of 24-wk-old wild-type and Isg15−/− mice. Bars, 500 µm. Quantifications of the cortical thickness (C.Th.) are given on the bottom. (F) Three point–bending assays of femora and microcompression testing of vertebral body L6 (spine) reveals that the force until bone failure (Fmax) is decreased in Isg15−/− mice. (B–D and F) n = 6. (G) Alizarin red staining of bone marrow cells differentiated into osteoblasts for 10 d and quantification of the mineralized area. (H) Quantification of the number of TRAP-positive multinucleated (MNC) osteoclasts differentiated from bone marrow precursor cells of wild-type and Isg15−/− mice. (G and H) n = 3. Error bars represent means ± SD. Asterisks indicate statistically significant differences (P < 0.05).
Figure 8.
Figure 8.
Heterozygosity of Fzd9 causes osteopenia. (A) von Kossa/van Gieson staining of nondecalcified sections and µCT scanning of vertebral bodies from 70-wk-old wild-type, Fzd9+/−, and Fzd9−/− mice. Bars, 1 mm. (B) Cross-sectional µCT scanning of femora. Bars, 500 µm. Quantifications of the cortical thickness (C.Th.) are given on the bottom. (C) Histomorphometric quantification of the trabecular bone volume, the osteoblast number, and the bone formation rate. BV/TV, bone volume per tissue volume; Ob.N/B.Pm, osteoblast number per bone perimeter; BFR/BS, bone formation rate per bone surface. (D) X rays of the spine from an individual with WBS and osteoporosis. Bars, 10 cm. Note the fractures of vertebral bodies (arrows), one of them being surgically stabilized. (E) Microcompression testing of the spine and three point–bending assays of femora demonstrate a decreased biomechanical stability of Fzd9+/− and Fzd9−/− bones. Fmax, force until bone failure. Error bars represent means ± SD (n = 6). Asterisks represent a statistically significant difference (P < 0.05).

Comment in

  • Developement: Strong bones: got FZD9?
    David R. David R. Nat Rev Mol Cell Biol. 2011 May;12(5):280. doi: 10.1038/nrm3103. Epub 2011 Apr 7. Nat Rev Mol Cell Biol. 2011. PMID: 21471999 No abstract available.

References

    1. Almeida M., Han L., Bellido T., Manolagas S.C., Kousteni S. 2005. Wnt proteins prevent apoptosis of both uncommitted osteoblast progenitors and differentiated osteoblasts by beta-catenin-dependent and -independent signaling cascades involving Src/ERK and phosphatidylinositol 3-kinase/AKT. J. Biol. Chem. 280:41342–41351 10.1074/jbc.M502168200 - DOI - PubMed
    1. Bodine P.V., Zhao W., Kharode Y.P., Bex F.J., Lambert A.J., Goad M.B., Gaur T., Stein G.S., Lian J.B., Komm B.S. 2004. The Wnt antagonist secreted frizzled-related protein-1 is a negative regulator of trabecular bone formation in adult mice. Mol. Endocrinol. 18:1222–1237 10.1210/me.2003-0498 - DOI - PubMed
    1. Boyden L.M., Mao J., Belsky J., Mitzner L., Farhi A., Mitnick M.A., Wu D., Insogna K., Lifton R.P. 2002. High bone density due to a mutation in LDL-receptor-related protein 5. N. Engl. J. Med. 346:1513–1521 10.1056/NEJMoa013444 - DOI - PubMed
    1. Cherniske E.M., Carpenter T.O., Klaiman C., Young E., Bregman J., Insogna K., Schultz R.T., Pober B.R. 2004. Multisystem study of 20 older adults with Williams syndrome. Am. J. Med. Genet. A. 131A:255–264 10.1002/ajmg.a.30400 - DOI - PubMed
    1. Cummings S.R., San Martin J., McClung M.R., Siris E.S., Eastell R., Reid I.R., Delmas P., Zoog H.B., Austin M., Wang A., et al. ; FREEDOM Trial 2009. Denosumab for prevention of fractures in postmenopausal women with osteoporosis. N. Engl. J. Med. 361:756–765 (published erratum appears in N. Engl. J. Med. 2009. 361: 1914) 10.1056/NEJMoa0809493 - DOI - PubMed

Publication types