. 2011 May;156(1):346-56.
doi: 10.1104/pp.110.171702. Epub 2011 Mar 14.

Genome-wide analysis reveals gene expression and metabolic network dynamics during embryo development in Arabidopsis

Affiliations

Genome-wide analysis reveals gene expression and metabolic network dynamics during embryo development in Arabidopsis

Daoquan Xiang et al. Plant Physiol. 2011 May.

Abstract

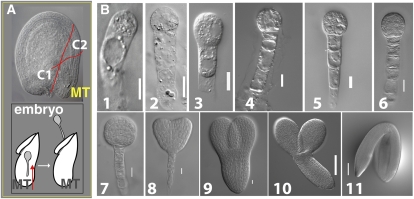
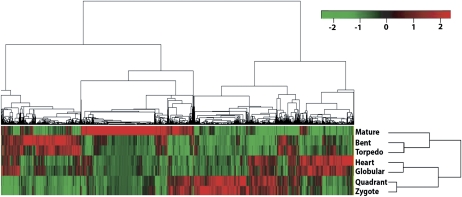
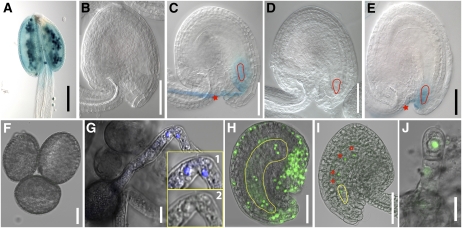
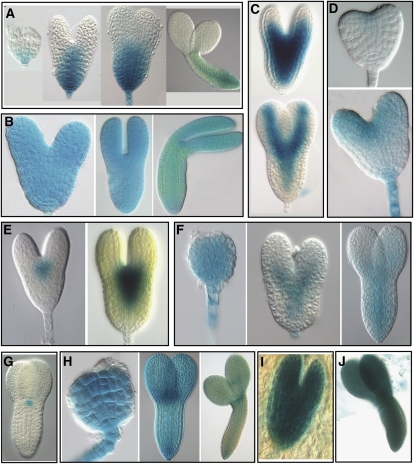
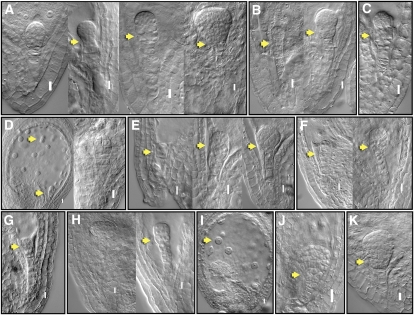
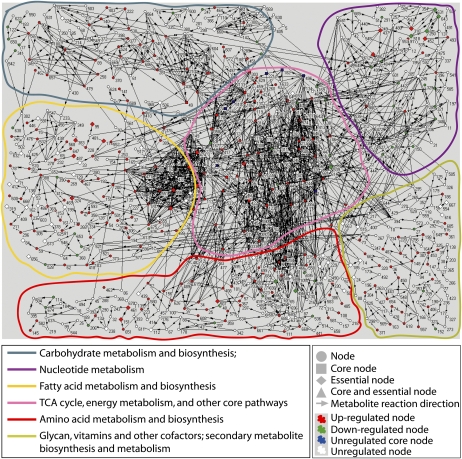
Embryogenesis is central to the life cycle of most plant species. Despite its importance, because of the difficulty associated with embryo isolation, global gene expression programs involved in plant embryogenesis, especially the early events following fertilization, are largely unknown. To address this gap, we have developed methods to isolate whole live Arabidopsis (Arabidopsis thaliana) embryos as young as zygote and performed genome-wide profiling of gene expression. These studies revealed insights into patterns of gene expression relating to: maternal and paternal contributions to zygote development, chromosomal level clustering of temporal expression in embryogenesis, and embryo-specific functions. Functional analysis of some of the modulated transcription factor encoding genes from our data sets confirmed that they are critical for embryogenesis. Furthermore, we constructed stage-specific metabolic networks mapped with differentially regulated genes by combining the microarray data with the available Kyoto Encyclopedia of Genes and Genomes metabolic data sets. Comparative analysis of these networks revealed the network-associated structural and topological features, pathway interactions, and gene expression with reference to the metabolic activities during embryogenesis. Together, these studies have generated comprehensive gene expression data sets for embryo development in Arabidopsis and may serve as an important foundational resource for other seed plants.


Figures

Figure 1.
Figure 1.
Embryo isolation from developing seeds of Arabidopsis. A, Nomarski image of ovule at fertilization showing two incisions (C1 and C2) made with forceps to detach the micropylar tube (MT; A, top). Isolated MT with the embryo inside is gently manipulated with forceps in the direction shown (arrow) to release the embryo (A, bottom). B, Nomarski images of dissected Arabidopsis embryos (B1–B11). Elongated zygote (B1); one-cell (B2); two-cell (B3); quadrant (B4); octant (B5); dermatogen (B6); globular (B7); heart (B8); torpedo (B9); bent (B10); and mature (B11) embryos. Bar = 0.01 mm (B1–B9); 0.1 mm (B10–B11).
Figure 2
Figure 2
. Hierarchical cluster analysis of gene expression patterns in Arabidopsis embryo development. Microarray analysis of seven embryo developmental stages identified 10,409 (shown in the top tree) differentially expressed genes at one or more stages referred to as modulated genes. We identified sets of modulated genes for each transition stage (namely, Z → Q, Q → G, G → H, H → T, T → B, B → M) using Limma software, then extracted their corresponding gene expression values for all seven stages (using single-channel normalization of Limma, see “Materials and Methods”). Z scores (statistical measure) were calculated for each of these genes and then used for hierarchical clustering. The analyses clustered Z and Q stages as phase I, G and H as phase II, T and B as phase III, and M stage as a distinct phase IV. Red indicates up-regulated genes whereas green indicates down-regulated genes. Scale bar represents fold change (log2 value).
Figure 3.
Figure 3.
Examples of paternal- and maternal-enriched gene expression in early Arabidopsis embryogenesis. A to E, Expression of a paternally enriched gene (At3g28780) using GUS reporter after fertilization in the zygote. The At3g28780 promoter:GUS line showed pollen-specific expression (A), no detectable expression in the ovule before fertilization (B), and expression in the zygote after fertilization (C). No GUS expression was detected in the zygote (red outline) when this GUS reporter line was used as female parent and crossed with pollen from wild-type male parent (D). In the reciprocal cross (pollen from the GUS reporter line as male parent and wild-type female), the GUS expression was observed after fertilization in the zygote (E). The red star and red outline in C and E indicate GUS expression in the pollen tube and zygote, respectively. F to J, De novo expression of a maternally enriched gene (At4g07410) tagged with GFP in the zygote. The GFP reporter line showed no detectable expression in the pollen (F) or in the pollen tube (G) but showed expression in the female gametophyte (H). The inserts in G (1 and 2) showed 4′,6-diamino-phenylindole staining of sperm nuclei (1) but no GFP signal (2). The GFP signal was also detected in the unfertilized ovule and specifically in the embryo sac nuclei, namely, egg cell, two synergids, two polar nuclei, and three antipodals (embryo sac, yellow outline; H). When the pollen from the GFP reporter line (no detectable expression of GFP) was crossed with wild type as female, the GFP signal was observed in the zygote (yellow outline) and the endosperm nuclei (red stars; I). In the reciprocal cross where the pollen from wild type was crossed into transgenic reporter line as female, GFP expression was observed in the zygote (J). Bar = 0.05 mm (A–E, H, and I) and 0.01 mm (F, G, and J).
Figure 4.
Figure 4.
Expression patterns of GUS reporter constructs during Arabidopsis embryo development. Promoter:GUS transcriptional fusion constructs were generated with 10 selected embryo-expressed genes: At4g17800 (A); At1g67320 (B); At5g20885 (C); At5g43250 (D); At5g66070 (E); At1g27470 (F); At2g27250 (G); At5g41880 (H); At5g37478 (I); and At5g63780 (J). The expression values of these genes are shown in Supplemental Table S8c. These 10 reporter constructs were introduced into Arabidopsis and the corresponding transgenic lines were analyzed for GUS expression during embryo development. A range of expression patterns were observed including broad expression in the embryo (B, H–J), expression in the basal region (A), predominant expression in the apical region of the embryo and suspensor (D), expression in the axis and provascular domain (C and F), and expression in the shoot apical meristem (E and G) that includes CLAVATA3 (At2g27250)-based GUS reporter with a consistent expression pattern as previously reported (G). Overall, these GUS reporter expression patterns are consistent with the corresponding microarray results.
Figure 5.
Figure 5.
Functional analysis of selected TFs during Arabidopsis embryo development. Nomarski images of embryo-defective phenotypes observed with translational fusions of TFs with En repressor domain under the control of 35S promoter (“Materials and Methods”). Putative zinc-finger TFs: At3G24050 (A); At3G51080 (B); At5G66320 (C); At3G54810 (D); At4G32890 (E); HD-ZIP At4G37790 (F); BELL1 LIKE homeodomain, A4G34610 (G); WOX6, At2G28610 (H); TCP16, At3G45150 (I); GRAS family SCL7, At3G50650 (J); and MYB, At3G55730 (K). Embryo phenotypes (arrows) observed include arrest at two-cell stage (E), quadrant (G), and octant (I); defective hypophyseal cell division (J); abnormal divisions in the basal region of the embryo at later stages of development (A, B, E, F, H, and K); abnormal divisions in the upper suspensor cells (B and C); and abnormal endosperm cell division (D and I). Details of observed phenotypes summarized in Supplemental Table S8d. Bar = 0.01 mm.
Figure 6.
Figure 6.
Illustration of the dynamic metabolic network for torpedo-bent stages of Arabidopsis embryo development. The network model was generated in Pajek using the microarray data sets and KEGG database (Supplemental Table S6; “Materials and Methods”). Numbers represent the metabolites and the lines (with arrows) that connect the metabolites represent the genes encoding enzymes that catalyze their reactions (Supplemental Table S6). The pathways that represent six key biochemical reactions for carbohydrates, nucleotides, fatty acids, tricarboxylic acid cycle, amino acids, and vitamins are outlined in color (details in the bottom left box; see Supplemental Fig. S6 for metabolic networks of other embryo stages).

References

    1. Alonso JM, Ecker JR. (2006) Moving forward in reverse: genetic technologies to enable genome-wide phenomic screens in Arabidopsis. Nat Rev Genet 7: 524–536 - PubMed
    1. Baroux C, Autran D, Gillmor CS, Grimanelli D, Grossniklaus U. (2008) The maternal to zygotic transition in animals and plants. Cold Spring Harb Symp Quant Biol 73: 89–100 - PubMed
    1. Bayer M, Nawy T, Giglione C, Galli M, Meinnel T, Lukowitz W. (2009) Paternal control of embryonic patterning in Arabidopsis thaliana. Science 323: 1485–1488 - PubMed
    1. Becker JD, Boavida LC, Carneiro J, Haury M, Feijó JA. (2003) Transcriptional profiling of Arabidopsis tissues reveals the unique characteristics of the pollen transcriptome. Plant Physiol 133: 713–725 - PMC - PubMed
    1. Braybrook SA, Harada JJ. (2008) LECs go crazy in embryo development. Trends Plant Sci 13: 624–630 - PubMed

Publication types

MeSH terms

LinkOut - more resources