. 2011 Apr;121(4):1402-11.
doi: 10.1172/JCI44442. Epub 2011 Mar 14.

Lipid profiling identifies a triacylglycerol signature of insulin resistance and improves diabetes prediction in humans

Affiliations

Lipid profiling identifies a triacylglycerol signature of insulin resistance and improves diabetes prediction in humans

Eugene P Rhee et al. J Clin Invest. 2011 Apr.

Abstract

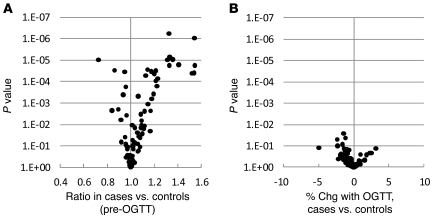
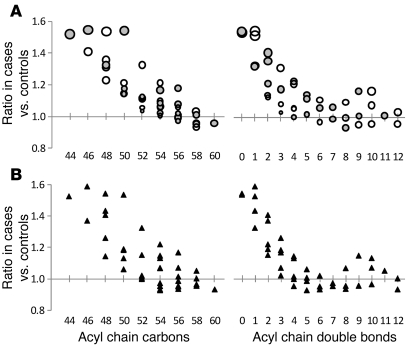
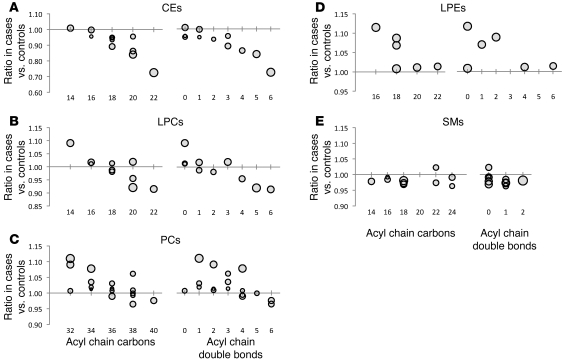
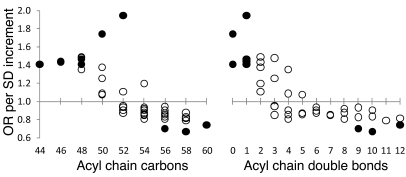
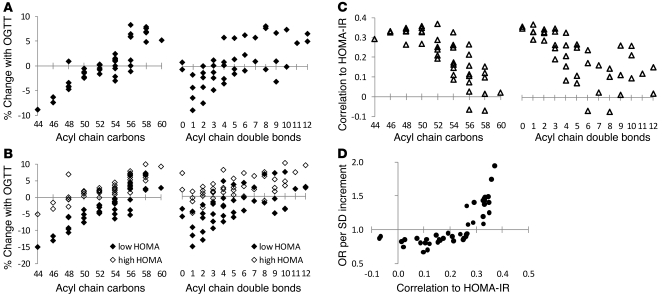
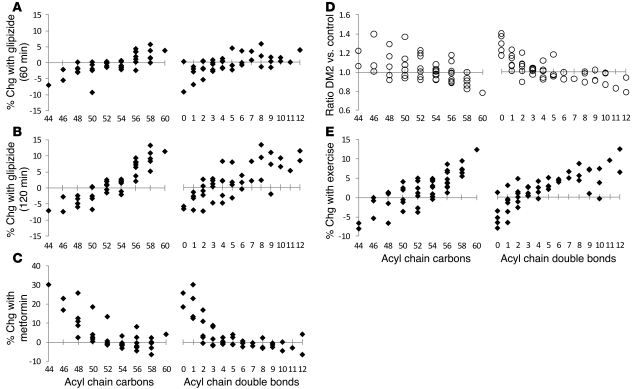
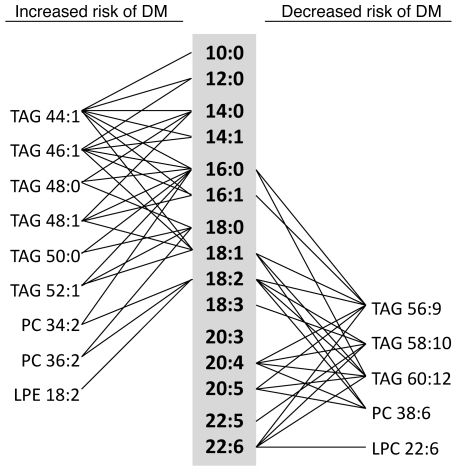
Dyslipidemia is an independent risk factor for type 2 diabetes, although exactly which of the many plasma lipids contribute to this remains unclear. We therefore investigated whether lipid profiling can inform diabetes prediction by performing liquid chromatography/mass spectrometry-based lipid profiling in 189 individuals who developed type 2 diabetes and 189 matched disease-free individuals, with over 12 years of follow up in the Framingham Heart Study. We found that lipids of lower carbon number and double bond content were associated with an increased risk of diabetes, whereas lipids of higher carbon number and double bond content were associated with decreased risk. This pattern was strongest for triacylglycerols (TAGs) and persisted after multivariable adjustment for age, sex, BMI, fasting glucose, fasting insulin, total triglycerides, and HDL cholesterol. A combination of 2 TAGs further improved diabetes prediction. To explore potential mechanisms that modulate the distribution of plasma lipids, we performed lipid profiling during oral glucose tolerance testing, pharmacologic interventions, and acute exercise testing. Levels of TAGs associated with increased risk for diabetes decreased in response to insulin action and were elevated in the setting of insulin resistance. Conversely, levels of TAGs associated with decreased diabetes risk rose in response to insulin and were poorly correlated with insulin resistance. These studies identify a relationship between lipid acyl chain content and diabetes risk and demonstrate how lipid profiling could aid in clinical risk assessment.


Figures

Figure 1
Figure 1. Case-control comparison for all lipid analytes in FHS.
(A) The geometric mean ratio of each lipid analyte level for cases versus that for controls in fasting pre-OGTT plasma. (B) The mean difference in percentage of change 2 hours after an oral glucose challenge in cases versus that in controls (percentage of change [chg] in cases minus percentage of change in controls). For both plots, P values are plotted on the y axis, and each data point represents a distinct lipid analyte.
Figure 2
Figure 2. TAG pattern of diabetes risk in FHS.
(A) The geometric mean ratio of TAG levels in cases versus that in controls in fasting pre-OGTT plasma. Each circle represents a distinct TAG, organized along the x axis based on total acyl chain carbon number (left) or double bond content (right). The size of each circle is proportional to the SD of the case/control ratios for each TAG; therefore, smaller circles indicate greater precision, whereas larger circles indicate lesser precision. Note, the 2 panels display the same data, simply arranged along the x axis by a different variable. (B) The geometric mean ratio of TAG levels in the subset of cases and controls in the bottom quartile of HOMA-IR (mean HOMA-IR, 1.03 for cases and 1.01 for controls; P = 0.36), organized along the x axis based on total acyl chain carbon number (left) or double bond content (right).
Figure 3
Figure 3. Relationship between diabetes risk and acyl chain content in non-TAG lipid analytes.
The geometric mean ratio of lipid levels in cases versus that in controls in fasting pre-OGTT plasma for (A) CEs, (B) LPCs, (C) PCs, (D) LPEs, and (E) SMs. Each data point represents a distinct lipid analyte, organized along the x axis based on total acyl chain carbon number (left) or double bond content (right). The size of each circle is proportional to the SD of the case/control ratios for each lipid; therefore, smaller circles indicate greater precision, whereas larger circles indicate lesser precision. Note, the 2 panels display the same data points, simply arranged along the x axis by a different variable.
Figure 4
Figure 4. TAG diabetes risk pattern following multivariable adjustment.
Conditional logistic regression models were fitted to assess the association between baseline TAG levels and future diabetes risk, adjusting for age, sex, BMI, fasting glucose, fasting insulin, total triglycerides, and HDL cholesterol. The OR for future diabetes risk per SD increment of TAG level is plotted for each TAG, organized along the x axis based on total acyl chain carbon number (left) or double bond content (right). Solid circles indicate ORs that were significant for relating diabetes to TAG (P < 0.05).
Figure 5
Figure 5. TAGs and insulin action in FHS.
(A) The mean percentage of change of each TAG in response to OGTT. (B) The mean percentage of change of each TAG in response to OGTT for individuals in the lowest (black diamonds) and highest (white diamonds) quartiles of HOMA-IR. (C) Spearman correlation coefficient for each TAG with HOMA-IR. For AC, each data point represents a distinct TAG, organized along the x axis based on total acyl chain carbon number (left) or double bond content (right). (D) The risk of diabetes for each TAG following multivariable adjustment and correlation with HOMA-IR.
Figure 6
Figure 6. TAG responses to pharmacologic and physiologic perturbations in alternative cohorts.
The mean percentage of change of each TAG (A) 60 minutes and (B) 120 minutes after glipizide administration in 20 nondiabetic individuals. (C) The mean percentage of change of each TAG after 4 doses of metformin in 20 nondiabetic individuals. (D) The geometric mean ratio of TAG levels in 10 individuals with type 2 diabetes (DM2) versus those in 40 nondiabetic controls. (E) The mean percentage of change of each TAG after exercise treadmill testing in 50 individuals. For AE, each data point represents a distinct TAG, organized along the x axis based on total acyl chain carbon number (left) or double bond content (right).
Figure 7
Figure 7. Fatty acyl chain constituents of diabetes risk predictors.
Individual fatty acids are listed in the gray column. Lipid analytes associated with an increased risk of diabetes (DM) following multivariable adjustment (except SM 22:0) are listed on the left, and lipid analytes associated with a decreased risk of diabetes following multivariable adjustment are listed on the right. Lines connect individual lipids with their fatty acid constituents.

References

    1. Chien K, et al. A prediction model for type 2 diabetes risk among Chinese people. Diabetologia. 2009;52(3):443–450. doi: 10.1007/s00125-008-1232-4. - DOI - PubMed
    1. D’Agostino RB, Jr, Hamman RF, Karter AJ, Mykkanen L, Wagenknecht LE, Haffner SM. Cardiovascular disease risk factors predict the development of type 2 diabetes: the insulin resistance atherosclerosis study. Diabetes Care. 2004;27(9):2234–2240. doi: 10.2337/diacare.27.9.2234. - DOI - PubMed
    1. Kahn HS, Cheng YJ, Thompson TJ, Imperatore G, Gregg EW. Two risk-scoring systems for predicting incident diabetes mellitus in U.S. adults age 45 to 64 years. Ann Intern Med. 2009;150(11):741–751. - PubMed
    1. Schulze MB, et al. Use of multiple metabolic and genetic markers to improve the prediction of type 2 diabetes: the EPIC-Potsdam Study. Diabetes Care. 2009;32(11):2116–2119. doi: 10.2337/dc09-0197. - DOI - PMC - PubMed
    1. Wilson PW, Meigs JB, Sullivan L, Fox CS, Nathan DM, D’Agostino RB Sr. Prediction of incident diabetes mellitus in middle-aged adults: the Framingham Offspring Study. Arch Intern Med. 2007;167(10):1068–1074. doi: 10.1001/archinte.167.10.1068. - DOI - PubMed

Publication types

MeSH terms