. 2011 Apr;121(4):1373-85.
doi: 10.1172/JCI42579. Epub 2011 Mar 14.

The Notch ligand Jagged2 promotes lung adenocarcinoma metastasis through a miR-200-dependent pathway in mice

Affiliations

The Notch ligand Jagged2 promotes lung adenocarcinoma metastasis through a miR-200-dependent pathway in mice

Yanan Yang et al. J Clin Invest. 2011 Apr.

Abstract

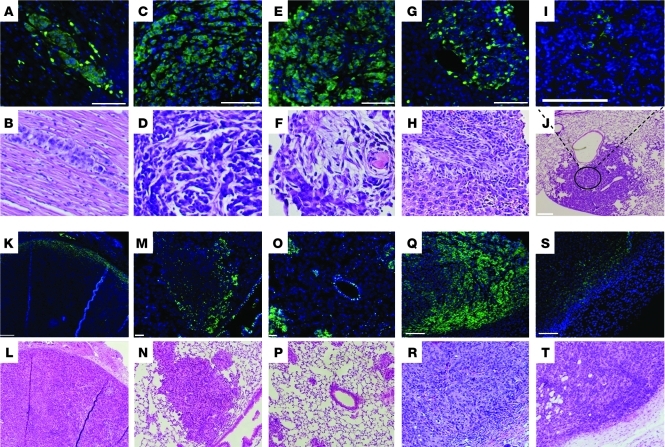
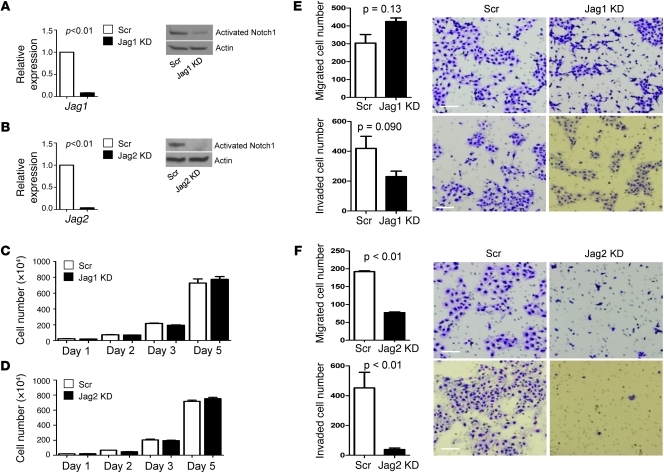
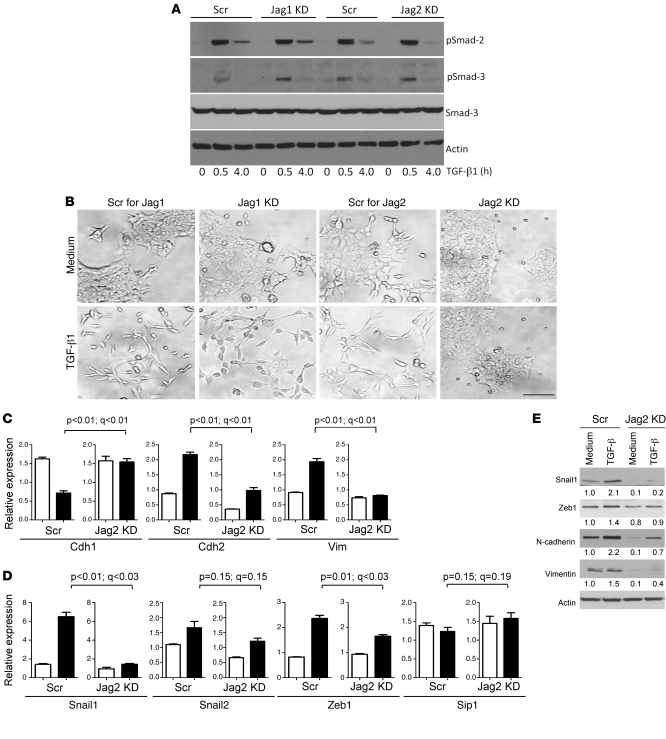
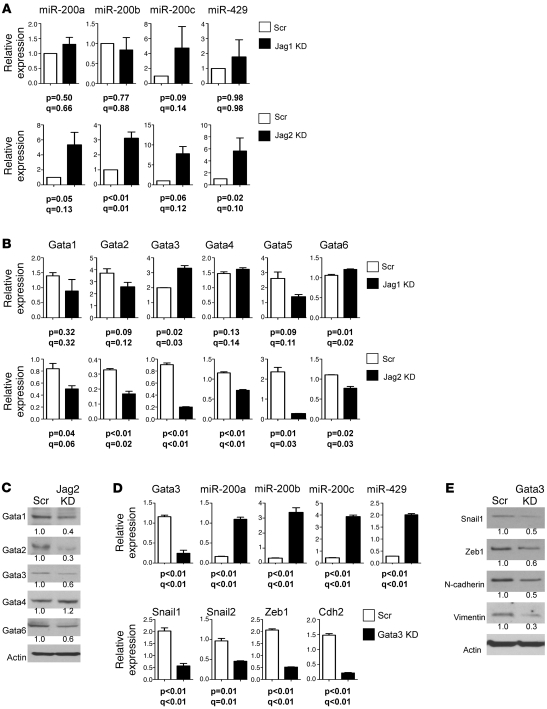
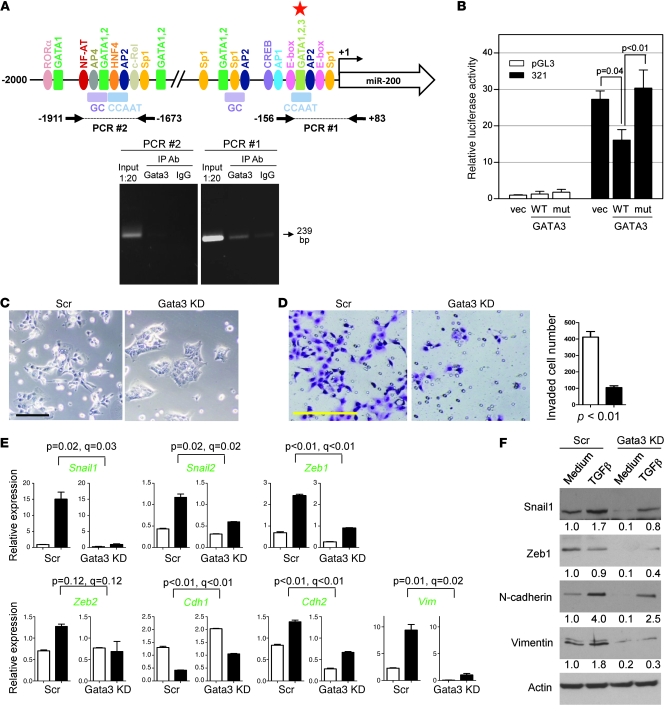
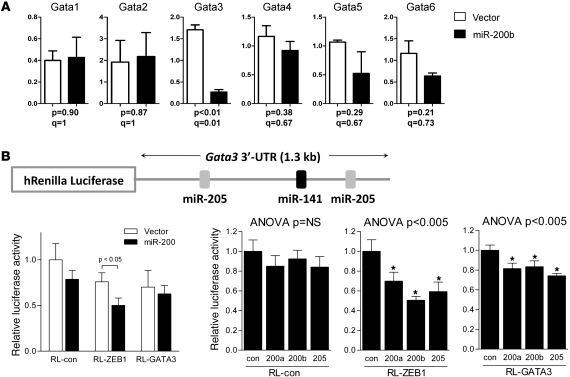
Epithelial tumor cells transit to a mesenchymal state in response to extracellular cues, in a process known as epithelial-to-mesenchymal transition (EMT). The precise nature of these cues has not been fully defined, an important issue given that EMT is an early event in tumor metastasis. Here, we have found that a population of metastasis-prone mouse lung adenocarcinoma cells expresses Notch and Notch ligands and that the Notch ligand Jagged2 promotes metastasis. Mechanistically, Jagged2 was found to promote metastasis by increasing the expression of GATA-binding (Gata) factors, which suppressed expression of the microRNA-200 (miR-200) family of microRNAs that target the transcriptional repressors that drive EMT and thereby induced EMT. Reciprocally, miR-200 inhibited expression of Gata3, which reversed EMT and abrogated metastasis, suggesting that Gata3 and miR-200 are mutually inhibitory and have opposing effects on EMT and metastasis. Consistent with this, high levels of Gata3 expression correlated with EMT in primary tumors from 2 cohorts of lung adenocarcinoma patients. These findings reveal what we believe to be a novel Jagged2/miR-200-dependent pathway that mediates lung adenocarcinoma EMT and metastasis in mice and may have implications for the treatment of human epithelial tumors.


Figures

Figure 1
Figure 1. CD133 expression in primary and metastatic tumors in KrasLA1/+p53R172HΔG/+ mice and in syngeneic mice injected with 344SQ cells.
CD133 staining (green) in metastases to (A and B) heart, (C and D) diaphragm, (E and F) chest wall, and (G and H) liver and (I and J) a primary lung tumor from KrasLA1/+p53R172HΔG/+ mice, (K and L) in a primary subcutaneous tumor and (M and N) large and (O and P) small lung metastases from syngeneic mice injected with 344SQ cells, and in a primary subcutaneous tumor in mice injected with (Q and R) CD133hi and (S and T) CD133lo 344SQ tumor cells. Sections were costained with DAPI (blue). Under each CD133/DAPI-stained panel is a panel with hematoxylin and eosin staining of an adjacent tissue section. Original magnification, ×20 (AI and MT); ×4 (JL). Scale bars: 100 μm (AI, L, N, and PT); 200 μm (J and K); 50 μm (M and O).
Figure 2
Figure 2. Transcriptional profiling of CD133hi and CD133lo fractions of 344SQ tumors.
(A) Heat map of 681 genes that were differentially expressed in CD133hi and CD133lo fractions of 344SQ tumors (n = 3 for each). Notch ligands (top) and Gene Ontology (GO) terms (right) are indicated. (B) Quantitative RT-PCR analysis performed on paired triplicate RNA samples was normalized on the basis of L32 mRNA, and CD133hi values were expressed as mean values (± SD) relative to those of CD133lo values, which were set at 1.0; P values are from paired t test. (C) Western blotting of CD133, Notch ligands, Notch isoforms, and Actin in CD133lo and CD133hi fractions of a 344SQ tumor. Actin indicates relative protein loading. Protein band density was quantified by densitometry, normalized to that of CD133lo cells (which was set at 1.0), and is indicated below each blot.
Figure 3
Figure 3. Characterization of Jagged-depleted 344SQ cells.
(A and B) Jagged depletion inactivates Notch. Quantification of (A) Jag1 and (B) Jag2 mRNA by quantitative PCR (bar graph) and Notch activation by Western blotting of cleaved Notch1 (gels) in Jagged1-depleted (Jag1 KD), Jagged2-depleted (Jag2 KD), and control (Scr) 344SQ transfectants. Quantitative PCR values were normalized based on L32 mRNA and expressed as the mean values of replicate (triplicate) samples relative to that of controls, which were set at 1.0. Actin indicates relative protein loading. (C and D) Jagged depletion has no effect on 344SQ cell proliferation. Quantification of (C) Jagged1-depleted and (D) Jagged2-depleted 344SQ cells grown in monolayer, counted at the indicated time points and expressed as the mean values (± SD) of replicate (triplicate) wells. (E and F) Inhibition of 344SQ cell migration and invasion by depletion of Jagged2 but not Jagged1. Images of migrated (top rows) and invaded (bottom rows) (E) Jagged1-depleted, (F) Jagged2-depleted, and (E and F) control 344SQ cells, which were counted and expressed as the mean values (± SD) of replicate (triplicate) wells (bar graphs), with P values from Welch’s t test using log-transformed data. Scale bars: 100 μm.
Figure 4
Figure 4. Abrogation of TGF-β–induced EMT by depletion of Jagged2 but not Jagged1.
(A) Jagged depletion has no effect on Smad phosphorylation. Western blotting of total and phosphorylated (p) Smads in Jagged-depleted and control transfectants treated for the indicated time points with TGF-β. Actin indicates relative protein loading. (B) Loss of TGF-β–induced morphologic changes in Jagged2-depleted but not Jagged1-depleted or control 344SQ cells. Jagged2-depleted cells retain epithelial features after treatment for 48 hours with TGF-β (1 ng/ml) (bottom right panel). Original magnification, ×20. Scale bar: 100 μm. (C and D) Loss of TGF-β–induced EMT by Jagged2 depletion. Quantitative PCR analysis of (C) epithelial/mesenchymal markers and (D) transcriptional regulators of EMT in Jagged2-depleted and control shRNA transfectants treated for 48 hours with (black bars) or without (white bars) TGF-β (1 ng/ml). Values represent the mean (± SD) of replicate (triplicate) samples. P values are based on comparison of TGF-β–treated samples (control vs. Jagged2 depleted). Q values estimate the fraction of comparisons with the given nominally significant P value that may arise from multiple testing. (E) Western blotting of Snail1, Zeb1, Cdh2, Vim, and Actin in control and Jagged2-depleted cells treated with medium or TGF-β (1 ng/ml) for 48 hours. Actin indicates relative protein loading. Protein band density was quantified by densitometry, normalized to that of medium-treated control cells (which is set at 1.0), and is indicated below each blot.
Figure 5
Figure 5. Jagged2 promotes EMT by inhibiting miR-200.
(A and B) Quantitative PCR analysis of (A) miR-200 and (B) Gata family members in Jagged1-depleted, Jagged2-depleted, and control shRNA transfectants. Values represent the mean (± SD) of replicate (triplicate) samples. Q values estimate the fraction of comparisons with the given nominally significant P value (2-tailed welch’s t test) that may arise from multiple testing. (C) Western blotting of GATA family members in Jagged2-depleted and control 344SQ transfectants. Densitometric quantification of bands indicated under each gel is expressed relative to that of control, which was set at 1.0. (D) Quantitative PCR analysis of Gata3, miR-200 family members, and EMT-related genes in Gata3-depleted and control shRNA transfectants. Values represent the mean (± SD) of replicate (triplicate) samples. (E) Western blotting of Snail1, Zeb1, Cdh2, Vim, and Actin in control and Gata3-depleted cells. Actin indicates relative protein loading. (C and E) Protein band density was quantified by densitometry, normalized to that of control cells (which is set at 1.0), and is indicated below each blot.
Figure 6
Figure 6. Gata3 directly suppresses miR-200 transcription and induces EMT.
(A) ChIP assays examined Gata3 binding to the miR-200b promoter in human H322 lung cancer cells. A 239-bp PCR product (arrow) was generated from the Gata3 IP samples (Gata3), using primers for a proximal promoter segment (PCR #1), but not from upstream regulatory sequences (PCR #2), which are illustrated graphically above the gel. Putative binding sites for GATA3 (red star) and other transcription factors (colored ovals and rectangles) predicted by TRANSFAC (BIOBASE Biological Databases). (B) MCF-7 cells cotransfected with reporters containing the proximal miR-200 promoter (–321 to +15 bp from the transcription start site) or empty luciferase vector (pGL3) and vectors containing Gata3 (WT), inactive Gata3 mutant (mut), or empty vector (vec). Values were expressed as the mean (± SD) of triplicate wells. The differences between groups were estimated by 1-way ANOVA (P < 0.01). (C) Images of Gata3-depleted or control 344SQ transfectants. Scale bar: 100 μm. (D) Images of invaded Gata3-depleted (black bar) and control (white bar) 344SQ transfectants, which were counted and expressed as the mean values (± SD) of replicate (triplicate) wells (bar graph). Scale bar: 100 μm. (E) Quantitative RT-PCR analysis of the indicated genes (green) in Gata3-depleted and control shRNA transfectants treated for 48 hours with (black bars) or without (white bars) TGF-β (1 ng/ml). Values represent the mean (± SD) of triplicate samples. (F) Western blotting of control and Gata3-depleted cells treated with medium or TGF-β (1 ng/ml) for 48 hours. Band density was quantified by densitometry, normalized to that of medium-treated control cells (which are set at 1.0), and is indicated below each blot.
Figure 7
Figure 7. miR-200 inhibits Gata3 expression.
(A) Forced miR-200 expression inhibits Gata3. Quantitative PCR analysis of 344SQ cells subjected to forced miR-200b expression or empty lentiviral vector transfection (vector). Values represent the mean (± SD) of replicate (triplicate) samples. P values are from 2-tailed Welch’s t test. Q values estimate the fraction of comparisons with the given nominally significant P value that may arise from multiple testing. (B) Gata3 is not a direct miR-200 gene target. Reporter assays were performed using reporters fused to 3′-UTR sequences from Gata3 (RL-GATA3); ZEB1 (RL-Zeb1), which was included as a positive control; or nothing (RL-con). The Gata3 3′-UTR reporter construct (with positions of putative miR-200 binding sites) is illustrated graphically. These reporters were transiently transfected into miR-200b (miR200) or control 344SQ stable transfectants or were transiently cotransfected with synthetic miR-200 precursors (200a, 200b, or 205) or control oligomers (con) into 344SQ cells. Values were normalized based on renilla luciferase and expressed as the mean values (± SD) of replicate (triplicate) wells relative to those of controls cotransfected with empty reporter and empty expression vector or scrambled precursors, which were set at 1.0. Asterisks indicate F-test contrast P < 0.005 versus control. Values of 1-way ANOVA analysis are indicated.

References

    1. Fisher GH, et al. Induction and apoptotic regression of lung adenocarcinomas by regulation of a K-Ras transgene in the presence and absence of tumor suppressor genes. Genes Dev. 2001;15(24):3249–3262. - PMC - PubMed
    1. Guerra C, et al. Tumor induction by an endogenous K-ras oncogene is highly dependent on cellular context. Cancer Cell. 2003;4(2):111–120. doi: 10.1016/S1535-6108(03)00191-0. - DOI - PubMed
    1. Jackson EL, et al. Analysis of lung tumor initiation and progression using conditional expression of oncogenic K-ras. Genes Dev. 2001;15(24):3243–3248. doi: 10.1101/gad.943001. - DOI - PMC - PubMed
    1. Ji H, et al. K-ras activation generates an inflammatory response in lung tumors. Oncogene. 2006;25(14):2105–2112. doi: 10.1038/sj.onc.1209237. - DOI - PubMed
    1. Johnson L, et al. Somatic activation of the K-ras oncogene causes early onset lung cancer in mice. Nature. 2001;410(6832):1111–1116. doi: 10.1038/35074129. - DOI - PubMed

Publication types

MeSH terms